
- Title
-
Cohesin mutations are synthetic lethal with stimulation of WNT signaling
- Authors
- Chin, C.V., Antony, J., Ketharnathan, S., Labudina, A., Gimenez, G., Parsons, K.M., He, J., George, A.J., Pallota, M.M., Musio, A., Braithwaite, A.W., Guilford, P., Hannan, R.D., Horsfield, J.A.
- Source
- Full text @ Elife
( |
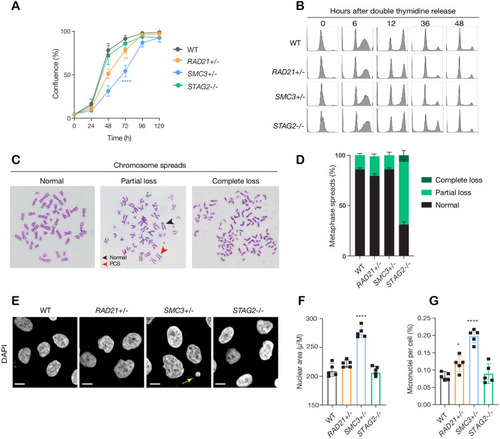
(A) Proliferation curves of MCF10A parental and cohesin-deficient clones. n = 3 independent experiments, mean ± sd, two-way ANOVA: **p≤0.01; ****p≤0.0001. Doubling times in hours of MCF10A parental cells are 15.5 ± 0.1; RAD21+/-, 17.1 ± 0.2; SMC3+/-, 21.4 ± 0.9; STAG2-/-, 16.4 ± 0.2 respectively. (B) Flow cytometry analysis of cell cycle progression. (C) Representative metaphase spread images of cohesin-deficient cells. Black arrow indicates a normal chromosome; Red arrow indicates premature chromatid separation (PCS). (D) Quantification of chromosome cohesion defects. A minimum of 20 metaphase spreads were examined per individual experiment, n = 2 independent experiments, mean ±s.d. (E) Representative confocal images of nuclear morphology. Scale bar, 15 μM. Yellow arrow indicates a micronucleus. (F) Quantification of nuclear area. (G) Quantification of micronuclei (MN). A minimum of 1000 cells was examined per individual experiment. n = 5 independent experiments (square symbols), mean ±s.d., one-way ANOVA: *p≤0.05; ****p≤0.0001. Source data is available for A,D,F,G in Figure 2—source data 1.
|
( |
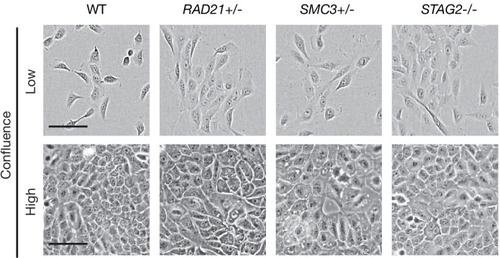
MCF10A cells were grown in low (1000 cells/well) and high density (4000 cells/well) in 96-well plates. Cohesin-deficient cells display a cobblestone-like morphology that is similar to MCF10A parental cells (WT). Scale bar, 250 μM.
|
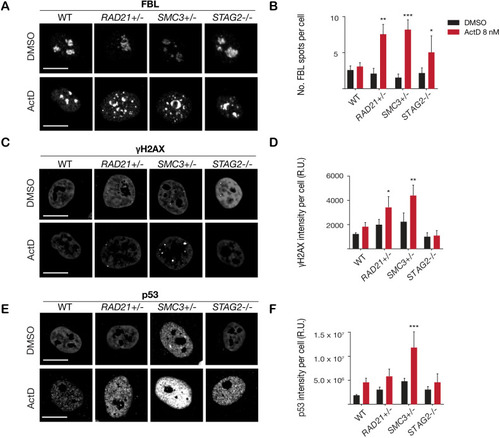
(A) Representative image and (B) quantification of nucleolar dispersal observed in parental (WT) MCF10A cells and cohesin-deficient clones after exposure to a DNA damaging agent, Actinomycin D (ActD) 8 nM. Fibrillarin (FBL) staining was used as a marker for nucleoli. (C) Representative image and (D) quantification of DNA damage foci observed in parental (WT) MCF10A cells and cohesin-deficient clones after exposure to ActD. An antibody detecting γH2AX was used to visualize foci of DNA double-strand breaks. (E) Representative image and (F) quantification of nuclear p53 in parental (WT) MCF10A cells and cohesin-deficient clones after exposure to ActD. A minimum of 500 cells was examined per individual experiment. n = 3 independent experiments, mean ± s.d., one-way ANOVA: *p≤0.05; **p≤0.01; ***p≤0.0005. Scale bar, 15 μM. Source data is available for Figure 2B,D,FFigure 3—source data 1.
|
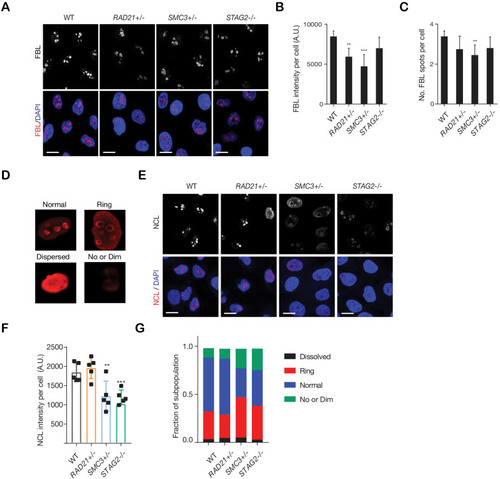
Cohesin-deficient cells show altered nucleolar morphology. ( |
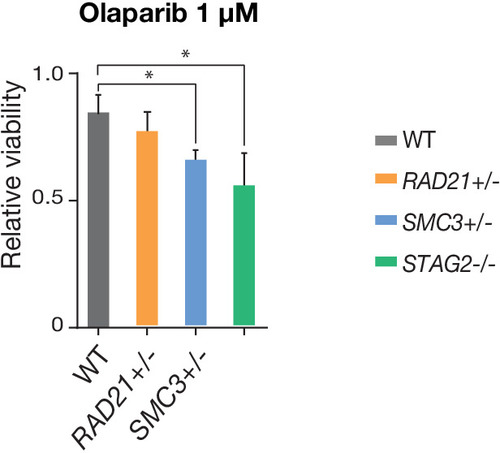
PARP sensitivity of cohesin-deficient cells. STAG2- and SMC3-deficient MCF10A cells show reduced viability following 48 hr of treatment with the PARP inhibitor, Olaparib, relative to parental cells (WT). n = 2 independent experiments, mean ±s.d., one-way ANOVA: *p≤0.05. |
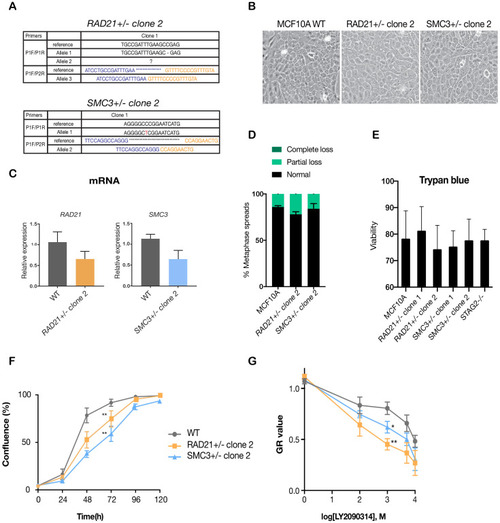
(A) Summary of the allele sequences for additional RAD21 and SMC3 heterozygous clones, RAD21+/- clone two and SMC3+/- clone 2. (B) Cohesin-deficient clone 2 cells display a cobblestone-like morphology that is similar to MCF10A parental cells (WT). (C) RNA levels of the targeted genes in the additional MCF10A cohesin-deficient clones. (D) Quantification of chromosome cohesion defects in RAD21+/- clone two and SMC3+/- clone 2. A minimum of 20 metaphase spreads were examined per individual experiment, n = 2 independent experiments, mean ±s.d. (E) Trypan blue measurement of cell viability for all cohesin-deficient clones in this study. Survival rates of mutant clones under standard culture conditions are not significantly different from wild type, n = 2 independent experiments, mean ±s.d. (F) Proliferation curves of MCF10A parental and RAD21+/- clone two and SMC3+/- clone 2. (G) Dose-response curves were generated for validation of LY2090314 in RAD21+/- clone two and SMC3+/- clone two compared with MCF10A cells. For (F) and (G), n = 3 independent experiments, mean ± sd, two-way ANOVA: *p≤0.05; **p≤0.01. |
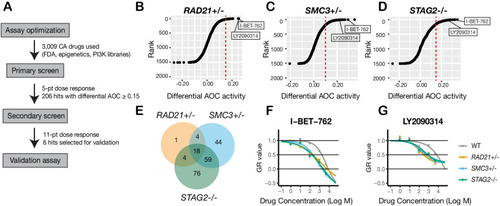
(A) Schematic overview of the synthetic lethal screen. (B,C,D) Overview of the differential area over the curve (AOC) activity of all compounds tested in cohesin-deficient cell lines relative to parental MCF10A cells in the primary screen. A threshold of differential AOC ≥ 0.15 (red dashed lines) was used to filter candidate compounds of interest. (E) Venn diagram showing the number of common and unique compounds that inhibited RAD21+/-, SMC3+/-, and STAG2-/- in the primary screen. (F,G) Dose-response curves of I-BET-762 and LY2090314. Source data is available for B–E in Figure 4—source data 1. |
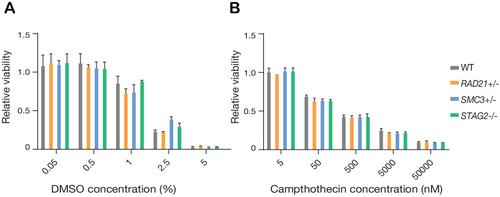
Synthetic lethal screen controls. ( |
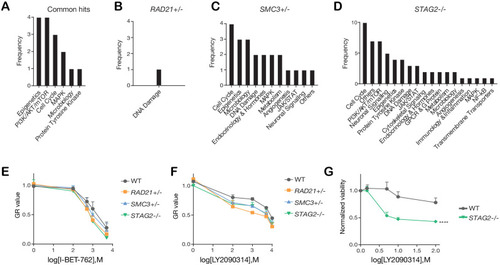
Categories of compounds that differentially inhibit cohesin-deficient cells. ( |
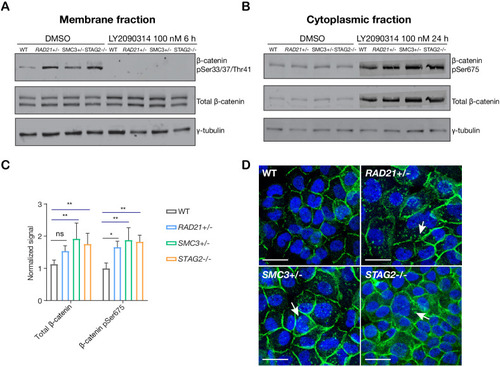
(A) Immunoblot of the membrane fraction of parental (WT) and cohesin-deficient MCF10A cells shows increased basal level of β-catenin phosphorylation at Ser33/37/Thr41. (B) Immunoblot of the cytoplasmic fraction shows increased level of both total and phosphorylated β-catenin at Ser675 after parental (WT) and cohesin-deficient MCF10A cells were treated with LY2090314 at 100 nM for 24 hr. (C) Quantification of protein levels for total and phosphorylated β-catenin at Ser675. n = 3 independent experiments, mean ± s.d., one-way ANOVA: *p≤0.05, **p≤0.01. (D) Immunofluorescence images show cytosolic accumulation of active β-catenin in cohesin-deficient MCF10A cells treated with LY2090314 100 nM for 24 hr, relative to parental (WT) MCF10A cells. White arrows indicate puncta of β-catenin (pSer675). Scale bar = 25 μM. Full length blots and molecular size markers are available for A,B in Figure 5—source data 1. Source quantification data is available for C in Figure 5—source data 2.
|
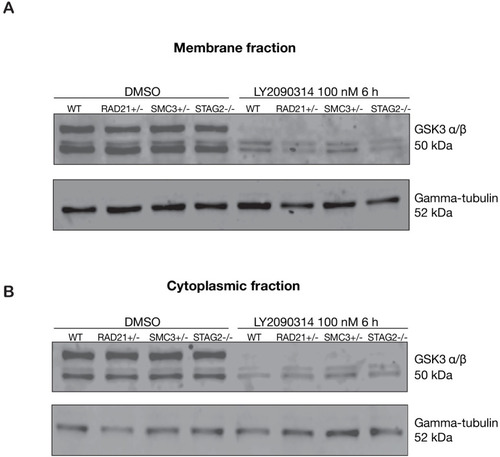
GSK3 levels are unaffected in cohesin-deficient MCF10A cells. Anti-GSK3 immunoblot of membrane fraction from parental MCF10A (WT) or cohesin-deficient cells treated with either DMSO or 100 nM LY2090314. ( |
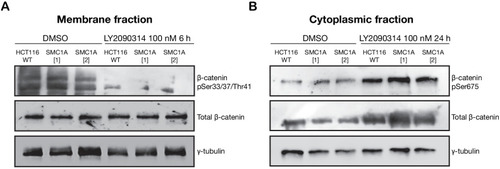
LY2090314-mediated WNT stimulation leads to increased β-catenin stabilization in SMC1A mutant HCT116 cells. Unmodified HCT116 cells (WT), and cells modified to contain |
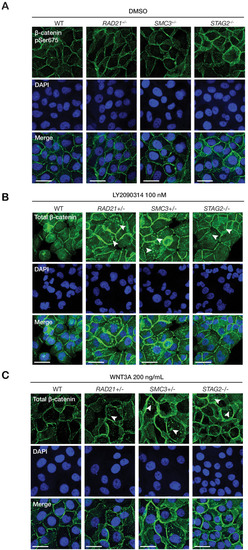
WNT3A phenocopies LY2090314-mediated β-catenin accumulation in the cytoplasm. Immunofluorescence images show that ( |
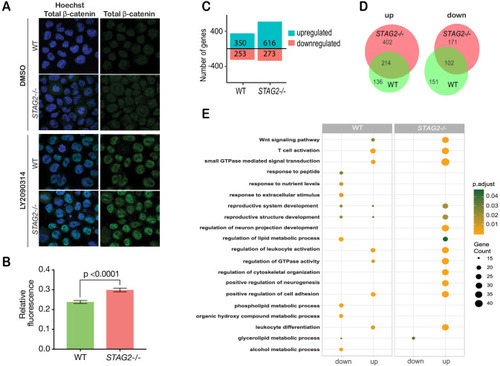
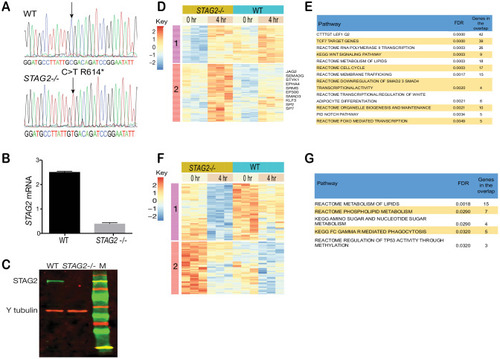
(A) Immunofluorescence images showing slightly increased nuclear accumulation of β-catenin in STAG2-CMK cells (STAG2-/-) compared to parental (WT) following treatment with LY2090314 at 100 nM for 24 hr. (B) Quantification of nuclear total β-catenin in parental (WT) and STAG2-CMK cells (STAG2-/-) cells. Fluorescence of nuclear total β-catenin was determined relative to the nuclear area. Image J was used quantify cells from 10 different confocal fields. The graph depicts s.e.m. from analyses of 170–188 cell nuclei, and the p value was calculated using a student’s t test. (C) Histogram showing the number of genes upregulated or downregulated at FDR ≤ 0.05 upon WNT3A treatment in parental (WT) and STAG2-/- CMK cells. WNT3A stimulation was performed on three biological replicates, from three independent experiments. (D) Overlap of genes significantly upregulated or downregulated (FDR ≤ 0.05) upon WNT3A treatment between parental (WT) and STAG2-/- CMK cells. (E) Top enriched pathways (ranked by gene count) from the significantly downregulated and upregulated genes (FDR ≤ 0.05) following WNT3A treatment in STAG2-/- and parental (WT) CMK cells using the ClusterProfiler R package on the Gene Ontology Biological Process dataset modeling for both cell types (WT or STAG2-/-) and regulation pattern (up- or downregulation). Source data is available for C,D in Figure 6—source data 1.
|
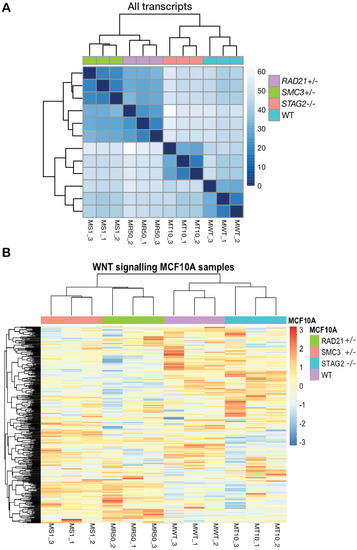
RNA-sequencing profiling of cohesin-deficient MCF10A cells. ( |
Enhanced sensitivity of cohesin-mutant CMK cells to Wnt stimulation. ( |
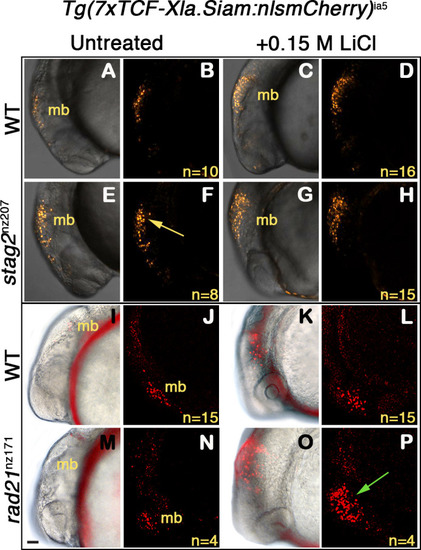
Wnt reporter Tg(7xTCF-Xla.Siam:nlsmCherry)ia5 control embryos, Tg(7xTCF-Xla.Siam:nlsmCherry)ia5;stag2bnz207 and Tg(7xTCF-Xla.Siam:nlsmCherry)ia5;rad21nz171 cohesin-mutant embryos were treated with 0.15 M LiCl from 4 hpf to 20 hpf. (A–H) max projections of 4 (10 μm) optical sections. (A,C,E,G) TD (transmitted light detector) images merged with confocal images. (B,D,F,H) confocal images alone. (I,K,M,O) Brightfield/fluorescent and (J,N,L,P) confocal images of the same embryos in I,K,M,O. (A–D) and (I–J) Tg(7xTCF-Xla.Siam:nlsmCherry)ia5 control embryos (WT) have low level fluorescence (Wnt reporter activity) in the midbrain that is increased following treatment. (E–H) Tg(7xTCF-Xla.Siam:nlsmCherry)ia5; stag2bnz207 embryos have elevated baseline levels of fluorescence (Wnt reporter activity) relative to controls (yellow arrow) with not much further increase upon LiCl treatment. (M–P) Tg(7xTCF-Xla.Siam:nlsmCherry)ia5; rad21nz171 cohesin-mutant embryos show enhanced Wnt reporter activity in the midbrain (green arrow) upon LiCl treatment, relative to controls. hpf, hours post-fertilization. mb, midbrain. Scale bar, 50 µm.
|