Image
Figure Caption

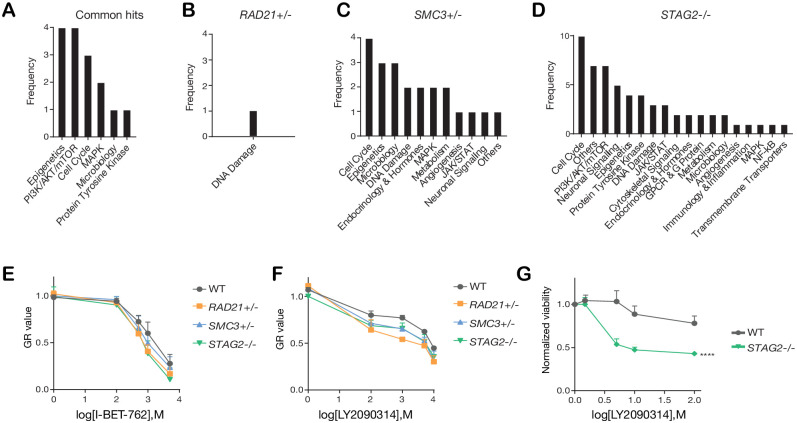
Figure 4—figure supplement 2. Categories of compounds that differentially inhibit cohesin-deficient cells. Categories of compounds that differentially inhibit cohesin-deficient cells.

(A) Common and (B,C,D) unique categories of compounds identified in the primary screen. See Figure 4—source data 1 for details. (E,F) Dose-response curves were generated for validation of I-BET-762 and LY2090314 in MCF10A cells. (G) Dose-response curve of LY2090314 in the K562 STAG2R614* mutant cell line. Two-way ANOVA: ****p≤0.0001 Source data is available for Figure 4A–D in Figure 4—source data 2.

Acknowledgments
This image is the copyrighted work of the attributed author or publisher, and ZFIN has permission only to display this image to its users. Additional permissions should be obtained from the applicable author or publisher of the image. Full text @ Elife