
|
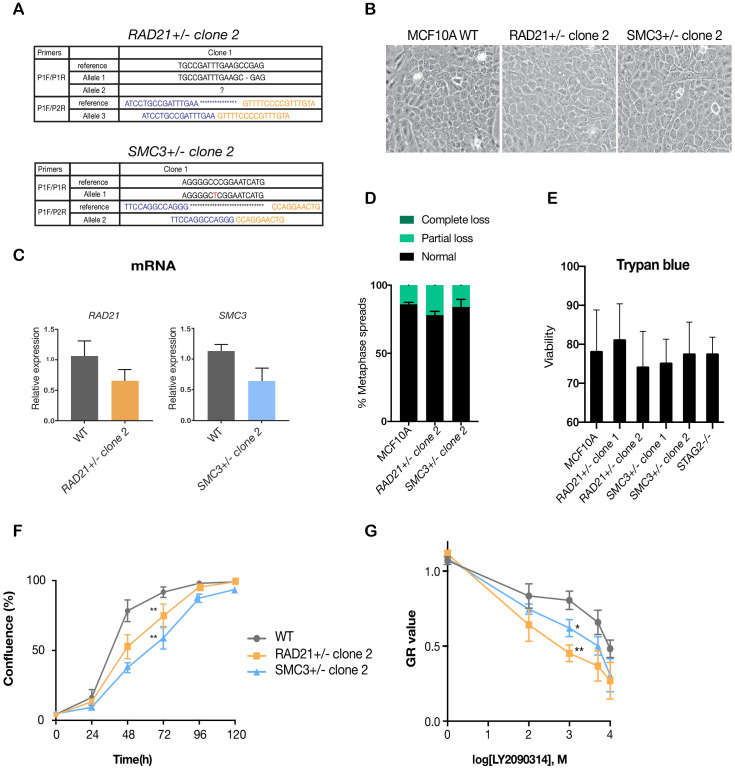
Figure 3—figure supplement 3.
(A) Summary of the allele sequences for additional RAD21 and SMC3 heterozygous clones, RAD21+/- clone two and SMC3+/- clone 2. (B) Cohesin-deficient clone 2 cells display a cobblestone-like morphology that is similar to MCF10A parental cells (WT). (C) RNA levels of the targeted genes in the additional MCF10A cohesin-deficient clones. (D) Quantification of chromosome cohesion defects in RAD21+/- clone two and SMC3+/- clone 2. A minimum of 20 metaphase spreads were examined per individual experiment, n = 2 independent experiments, mean ±s.d. (E) Trypan blue measurement of cell viability for all cohesin-deficient clones in this study. Survival rates of mutant clones under standard culture conditions are not significantly different from wild type, n = 2 independent experiments, mean ±s.d. (F) Proliferation curves of MCF10A parental and RAD21+/- clone two and SMC3+/- clone 2. (G) Dose-response curves were generated for validation of LY2090314 in RAD21+/- clone two and SMC3+/- clone two compared with MCF10A cells. For (F) and (G), n = 3 independent experiments, mean ± sd, two-way ANOVA: *p≤0.05; **p≤0.01.Data replication with additional MCF10A isogenic cell lines with cohesin gene deletions.