
|
Figure 2
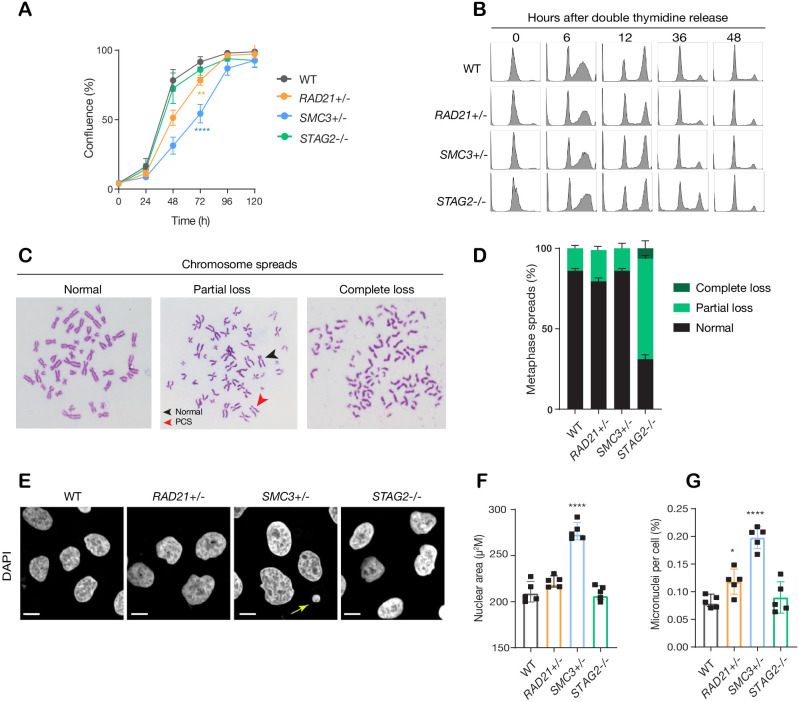
(A) Proliferation curves of MCF10A parental and cohesin-deficient clones. n = 3 independent experiments, mean ± sd, two-way ANOVA: **p≤0.01; ****p≤0.0001. Doubling times in hours of MCF10A parental cells are 15.5 ± 0.1; RAD21+/-, 17.1 ± 0.2; SMC3+/-, 21.4 ± 0.9; STAG2-/-, 16.4 ± 0.2 respectively. (B) Flow cytometry analysis of cell cycle progression. (C) Representative metaphase spread images of cohesin-deficient cells. Black arrow indicates a normal chromosome; Red arrow indicates premature chromatid separation (PCS). (D) Quantification of chromosome cohesion defects. A minimum of 20 metaphase spreads were examined per individual experiment, n = 2 independent experiments, mean ±s.d. (E) Representative confocal images of nuclear morphology. Scale bar, 15 μM. Yellow arrow indicates a micronucleus. (F) Quantification of nuclear area. (G) Quantification of micronuclei (MN). A minimum of 1000 cells was examined per individual experiment. n = 5 independent experiments (square symbols), mean ±s.d., one-way ANOVA: *p≤0.05; ****p≤0.0001. Source data is available for A,D,F,G in Figure 2—source data 1.
minor deficiencies in cell cycle progression, chromosome segregation and nuclear morphology in cohesin-deficient isogenic cell lines.