Image
Figure Caption

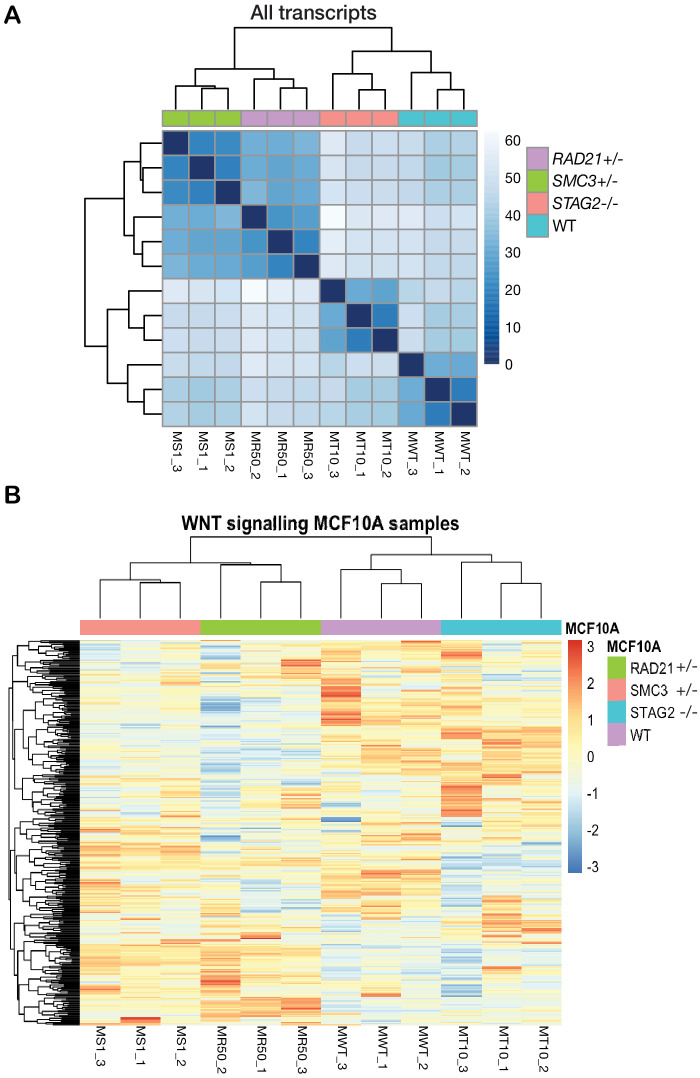
Figure 6—figure supplement 1. RNA-sequencing profiling of cohesin-deficient MCF10A cells. RNA-sequencing profiling of cohesin-deficient MCF10A cells.

(A) Whole genome correlation matrix of MCF10A cells. The dendrogram shows a common clustering of the biological replicates. There are two main clusters. The STAG2-/- (MT10_1–3) transcriptomes are more similar to the WT (MWT_1–3). SMC3+/- (MS_1–3) and RAD21+/- (MR50_1–3) populate the second cluster. (B) MCF10A gene expression profile of genes involved in WNT signaling pathways according to Gene Ontology annotation (GO:0016055). The heatmap shows the clustering of the scaled (z-score) normalized count (log2RPKM) for each replicate. RNA-sequencing data is available in the GEO database under GSE154086.

Acknowledgments
This image is the copyrighted work of the attributed author or publisher, and ZFIN has permission only to display this image to its users. Additional permissions should be obtained from the applicable author or publisher of the image. Full text @ Elife