
Figure 6
- ID
- ZDB-FIG-201223-34
- Publication
- Chin et al., 2020 - Cohesin mutations are synthetic lethal with stimulation of WNT signaling
- Other Figures
-
- Figure 1.
- Figure 2
- Figure 2—figure supplement 1.
- Figure 2—figure supplement 2.
- Figure 3
- Figure 3—figure supplement 1.
- Figure 3—figure supplement 2.
- Figure 3—figure supplement 3.
- Figure 4
- Figure 4—figure supplement 1.
- Figure 4—figure supplement 2.
- Figure 5
- Figure 5—figure supplement 1.
- Figure 5—figure supplement 2.
- Figure 5—figure supplement 3.
- Figure 6
- Figure 6—figure supplement 1.
- Figure 6—figure supplement 2.
- Figure 7.
- All Figure Page
- Back to All Figure Page
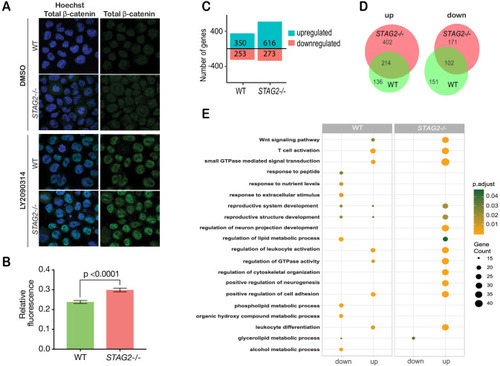
(A) Immunofluorescence images showing slightly increased nuclear accumulation of β-catenin in STAG2-CMK cells (STAG2-/-) compared to parental (WT) following treatment with LY2090314 at 100 nM for 24 hr. (B) Quantification of nuclear total β-catenin in parental (WT) and STAG2-CMK cells (STAG2-/-) cells. Fluorescence of nuclear total β-catenin was determined relative to the nuclear area. Image J was used quantify cells from 10 different confocal fields. The graph depicts s.e.m. from analyses of 170–188 cell nuclei, and the p value was calculated using a student’s t test. (C) Histogram showing the number of genes upregulated or downregulated at FDR ≤ 0.05 upon WNT3A treatment in parental (WT) and STAG2-/- CMK cells. WNT3A stimulation was performed on three biological replicates, from three independent experiments. (D) Overlap of genes significantly upregulated or downregulated (FDR ≤ 0.05) upon WNT3A treatment between parental (WT) and STAG2-/- CMK cells. (E) Top enriched pathways (ranked by gene count) from the significantly downregulated and upregulated genes (FDR ≤ 0.05) following WNT3A treatment in STAG2-/- and parental (WT) CMK cells using the ClusterProfiler R package on the Gene Ontology Biological Process dataset modeling for both cell types (WT or STAG2-/-) and regulation pattern (up- or downregulation). Source data is available for C,D in Figure 6—source data 1.
|