
|
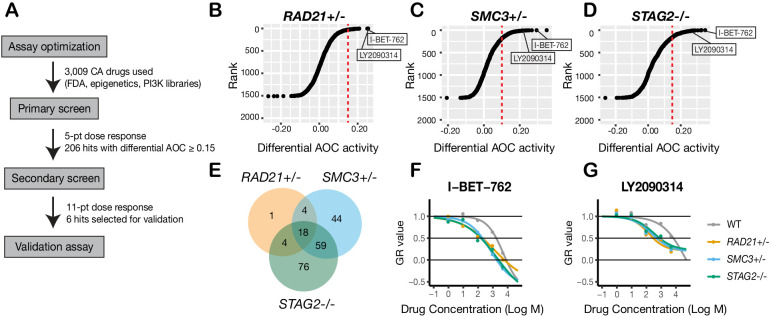
Figure 4
(A) Schematic overview of the synthetic lethal screen. (B,C,D) Overview of the differential area over the curve (AOC) activity of all compounds tested in cohesin-deficient cell lines relative to parental MCF10A cells in the primary screen. A threshold of differential AOC ≥ 0.15 (red dashed lines) was used to filter candidate compounds of interest. (E) Venn diagram showing the number of common and unique compounds that inhibited RAD21+/-, SMC3+/-, and STAG2-/- in the primary screen. (F,G) Dose-response curves of I-BET-762 and LY2090314. Source data is available for B–E in Figure 4—source data 1.A synthetic lethal screen identifies common sensitivity of cohesin-deficient cells to WNT activation and BET inhibition.