Image
Figure Caption

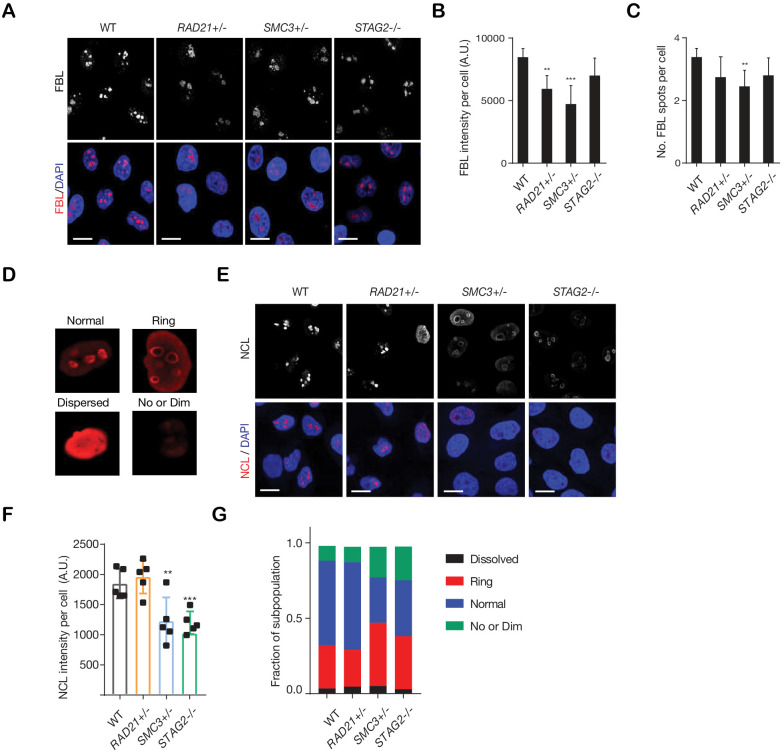
Figure 3—figure supplement 1. Cohesin-deficient cells show altered nucleolar morphology. Cohesin-deficient cells show altered nucleolar morphology.

(A) Representative images of nucleolar morphology as determined using fibrillarin (FBL) as a marker of nucleoli. (B,C) Quantification of FBL intensity and number of FBL spots per cell in each genotype. A minimum of 1000 cells was examined per individual experiment, n = 3 independent experiments, mean ± s.d., one-way ANOVA: *p≤0.05; **p≤0.01; ***p≤0.0005. (D) Types of nucleolar morphology observed in MCF10A parental cells. (E) Representative images of nucleolar morphology determined by using nucleolin (NCL) as a marker. (F) Quantification of NCL intensity per cell in each genotype. At least 500 cells were examined per individual experiment, n = 3 independent experiments, mean ±s.d., one-way ANOVA: **p≤0.01; ***p≤0.0005. (G) Quantification of NCL morphology classes present in cohesin-deficient cells. A.U., Arbitrary unit.

Acknowledgments
This image is the copyrighted work of the attributed author or publisher, and ZFIN has permission only to display this image to its users. Additional permissions should be obtained from the applicable author or publisher of the image. Full text @ Elife