
|
Figure 3
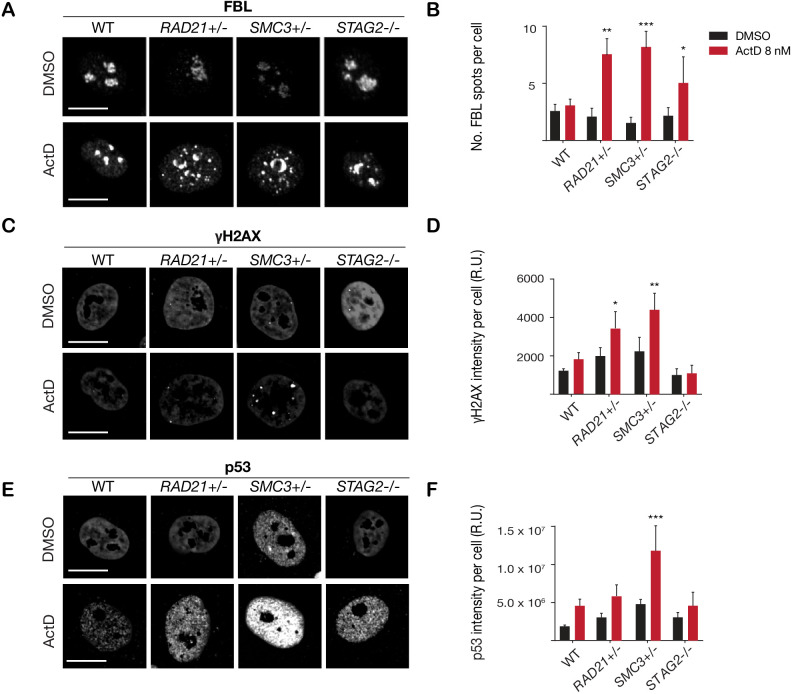
(A) Representative image and (B) quantification of nucleolar dispersal observed in parental (WT) MCF10A cells and cohesin-deficient clones after exposure to a DNA damaging agent, Actinomycin D (ActD) 8 nM. Fibrillarin (FBL) staining was used as a marker for nucleoli. (C) Representative image and (D) quantification of DNA damage foci observed in parental (WT) MCF10A cells and cohesin-deficient clones after exposure to ActD. An antibody detecting γH2AX was used to visualize foci of DNA double-strand breaks. (E) Representative image and (F) quantification of nuclear p53 in parental (WT) MCF10A cells and cohesin-deficient clones after exposure to ActD. A minimum of 500 cells was examined per individual experiment. n = 3 independent experiments, mean ± s.d., one-way ANOVA: *p≤0.05; **p≤0.01; ***p≤0.0005. Scale bar, 15 μM. Source data is available for Figure 2B,D,FFigure 3—source data 1.
Cohesin-deficient cells have increased sensitivity to nucleolar stress and DNA damaging agents.