FIGURE SUMMARY
Title

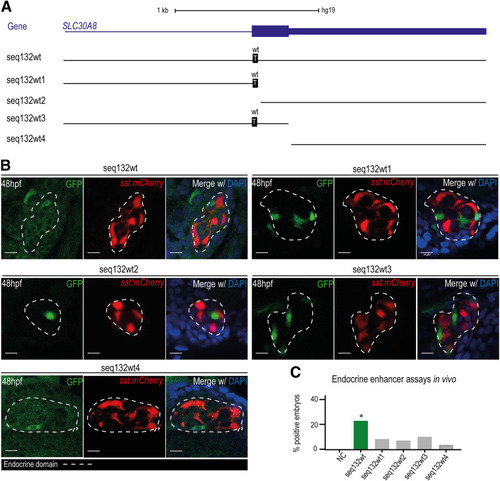
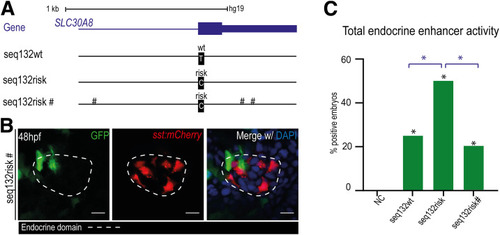
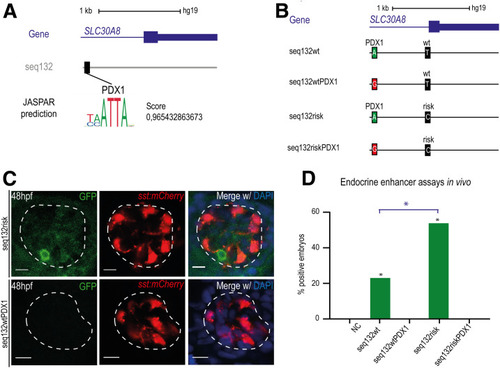
In vivo Reporter Assays Uncover Changes in Enhancer Activity Caused by Type 2 Diabetes Associated SNPs

Authors
Eufrásio, A., Perrod, C., Ferreira, F.J., Duque, M., Galhardo, M., Bessa, J.
Source
Full text @ Diabetes

A: Schematic representation of the Z48 vector (top) and a representative image of a Z48-injected embryo (bottom) showing GFP expression in the midbrain, mediated by the Z48 enhancer (blue), at 48 hpf. The expression of GFP in the midbrain functions as an internal control of transgenesis. Scale bar = 200 μm. B: Representative images of sst:mCherry (top) and ins:GFP (bottom) reporter lines at 48 hpf, showing mCherry and GFP expression in δ- and β-cells, respectively. Scale bars = 50 μm. C: Confocal images showing the endocrine pancreatic domain (dashed line), defined by the cross of the sst:mCherry and ins:GFP reporter lines. The 48-hpf embryos were counterstained with the nuclear marker DAPI. Scale bars = 10 μm. D: Percentage of embryos showing GFP-positive cells within the endocrine domain when injected with a vector containing GFP as reporter gene under the control of the insulin promoter (ins:GFP) (69%, n = 23) or with the Z48 vector without an endocrine enhancer (NC). E: Confocal images from 48-hpf embryos stained with anti-Nkx6.1 antibody (purple) to define the progenitor pancreatic domain (dashed line) in the sst:mCherry reporter line and the nuclear marker DAPI. Scale bars = 10 μm. F: Graph representing the percentage of embryos with GFP expression in progenitor cells when injected with a pancreatic progenitor enhancer (SOX9_PPE) (27%, n = 11) or the NC (0%, n = 43). *P < 0.05, by χ2 test.

A: Genomic landscapes of the putative enhancer seq58. Tracks represent H3K27ac, H3K4me1, histone variant H2A.Z, and TF binding (PDX1, NKX2.2, FOXA2, and NKX6.1) from ChIP-seq data of human endocrine pancreatic samples. Human ZFAND3 is the nearest gene to the putative enhancer (blue). The location of the type 2 diabetes–associated SNP (rs58692659) is represented as a vertical black line. B: In vivo reporter assay for endocrine pancreatic enhancers. Top panels show a representative confocal image a sst:mCherry zebrafish embryo injected with the Z48 enhancer reporter vector containing the seq73wt sequence, showing GFP-positive cells within the endocrine pancreatic domain (dashed line), contrasting that absent in embryos injected with NC (bottom). Scale bars = 10 μm. C: In vivo reporter assay for pancreatic progenitor enhancers. Confocal analysis of seq68 reporter assay shows colocalization of GFP-positive cells with Nkx6.1 progenitor marker, contrasting with NC for the pancreatic progenitor domain (dashed line) that did not show GFP-positive cells. All vectors were injected in the sst:mCherry reporter line and embryos analyzed at 48 hpf and stained with DAPI. Scale bars = 10 μm. D: Graph representing the percentage of embryos with GFP expression in endocrine pancreatic domain at 48 hpf for each sequence analyzed: seq58wt (36%, n = 56), seq68wt (13%, n = 47), seq73wt (28%, n = 47), seq132wt (23%, n = 34), seq219wt (24%, n = 38), seq460wt (27%, n = 36), seq72wt (0%, n = 27), seq117wt (0%, n = 21), seq119wt (4%, n = 27), seq790wt (0%, n = 20), and NC (0%, n = 43). E: Graph representing the number of embryos with GFP expression in pancreatic progenitor domain, defined by Nkx6.1 staining at 48 hpf, for each sequence analyzed: seq58wt (0%, n = 12), seq68wt (46%, n = 13), seq73wt (25%, n = 12), and NC (0%, n = 43). *P < 0.05, by χ2 test.

A: Representative confocal images for seq219wt, seq219risk, and NC. Seq219wt showed GFP expression in endocrine pancreatic domain (dashed line), defined by the sst:mCherry reporter line. The 48-hpf embryos were stained with DAPI. Scale bars = 10 µm. B: Graph showing the total percentage of positive embryos in wt and risk alleles for each of the 10 sequences analyzed: seq58wt/risk (36%, n = 56; 12%, n = 43, respectively), seq68wt/risk (13%, n = 47; 50%, n = 32), seq73wt/risk (28%, n = 47; 22%, n = 36), seq132wt/risk (23%, n = 34; 56%, n = 36), seq219wt/risk (24%, n = 38; 6%, n = 35), seq119wt/risk (4%, n = 27; 14%, n = 28), seq72wt/risk (0%, n = 27; 6%, n = 30), seq117wt/risk (0%, n = 21; 0%, n = 8), seq460wt/risk (27%, n = 36; 27%, n = 30), and seq790wt/risk (0%, n = 20; 0%, n = 14). Six sequences showed differential enhancer activity between wt and risk allele. *P < 0.05, by χ2 test.

A: Representative confocal images for the mouse seq132 (seq132mm enhancer chr15:52334298 + 52335281). Seq132mm enhancer showed GFP-positive cells within the endocrine pancreatic domain (dashed line) defined by the sst:mCherry reporter line. The 48-hpf embryos were stained with DAPI. Scale bars = 10 μm. Representative graph showing the total percentage of positive embryos for the sequence analyzed (13%, n = 35). *P < 0.05, by χ2 test. B: Genomic landscape of the mouse Slc30a8 gene (blue), showing 4C-seq profiles (black), with view point in Slc30a8 promoter (pink asterisk) in the Min6 cell line; zoom-out (top) and zoom-in (bottom) of the Slc30a8 gene and seq132mm enhancer. The targets line represents the regions where the interaction is significant. C: sgRNAs targeting murine Slc30a8 enhancer in CRISPRa or CRISPR assay in Min6 cells. Slc30a8 expression was calculated relative to the β-actin housekeeping gene by quantitative PCR. Dot blots represent the 10–90% quantile of six biological replicates. *P < 0.05, **P < 0.01. ctrl, control.

A: Schematic representation of the four analyzed fragments derived from seq132wt: seq132wt1, seq132wt2, seq132wt3, and seq132wt4. The gene SLC30A08 is represented in blue. The wt allele is discriminated in black boxes. B: Representative confocal images for the total sequence, seq132wt, and the four analyzed fragments showing GFP-positive cells in the endocrine pancreatic domain (dashed line) defined by the sst:mCherry reporter line. The 48-hpf embryos were stained with DAPI. Scale bars = 10 µm. C: Graph representing the total percentages of positive embryos for seq132wt (23%, n = 34), seq132wt1 (9.8%, n = 41), seq132wt2 (6.5%, n = 31), seq132wt3 (10%, n = 30), and seq132wt4 (4%, n = 23). *P < 0.05, by χ2 test.

A: Schematic representation of the three different analyzed versions of seq132: seq132wt, seq132risk, and seq132risk#. The gene SLC30A08 is represented in blue. The symbol # represents common variants with no association with type 2 diabetes. The wt and risk alleles are represented in black boxes. B: Representative confocal images for the seq132risk#, showing GFP expression in the endocrine pancreatic domain (dashed line) defined by the sst:mCherry reporter line. The 48-hpf embryos were stained with DAPI. Scale bars = 10 μm. C: Graph representing the total percentages of positive embryos for the seq132wt (23%, n = 34), seq132risk (56%, n = 36), and seq132risk# (20%, n = 20). *P < 0.05, by χ2 test.

A: PDX1 binding site prediction by JASPAR software. The human SLC30A8 is represented in blue. The vertical black line represents the single nucleotide mutation that overlaps with a PDX1 putative binding site. B: Schematic representation of the analyzed sequences: seq132wt, seq132wtPDX1, seq132risk, and seq132riskPDX1. The wt and risk alleles are discriminated in black boxes and the mutation in red boxes. The green boxes represent the binding site for PDX1. C: Representative confocal images for the analyzed sequence containing the risk variant in the absence (top) of the mutation in the putative binding site for PDX1, showing GFP expression in endocrine pancreatic domain (dashed line) defined by the sst:mCherry reporter line. The sequence containing the wt allele and the mutation (bottom) was not able to drive GFP expression. The 48-hpf embryos were stained with DAPI. Scale bars = 10 μm. D: Graph representing the total percentages of positive embryos for the different sequences represented in panel B: seq132wt (23%, n = 34), seq132wtPDX1 (0%, n = 21), seq132risk (56%, n = 36), and seq132riskPDX1 (0%, n = 20). *P < 0.05, by χ2 test.

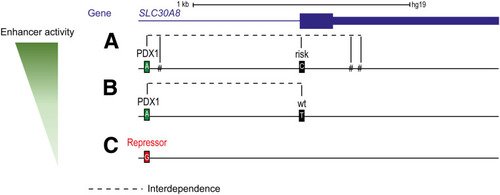
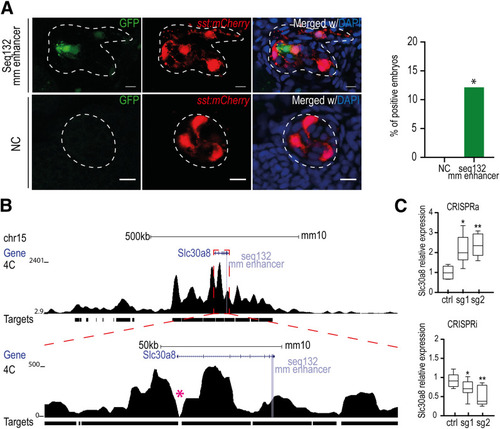
Theoretical model of the functional domains of seq132. Schematic representation from the three possible sequence versions and the respective associated enhancer activity level: high (A), low (B), and no enhancer activity (C). The gene SLC30A08 is represented in blue. The symbol # represents common variants with no association with type 2 diabetes. The wt and risk alleles are represented in black boxes, the putative repressor in red, and the binding site for PDX1 in green. The dashed line shows interdependence.

Acknowledgments
This image is the copyrighted work of the attributed author or publisher, and ZFIN has permission only to display this image to its users. Additional permissions should be obtained from the applicable author or publisher of the image. Full text @ Diabetes