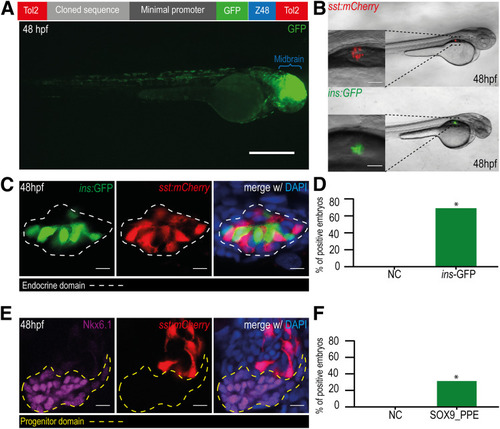
A: Schematic representation of the Z48 vector (top) and a representative image of a Z48-injected embryo (bottom) showing GFP expression in the midbrain, mediated by the Z48 enhancer (blue), at 48 hpf. The expression of GFP in the midbrain functions as an internal control of transgenesis. Scale bar = 200 μm. B: Representative images of sst:mCherry (top) and ins:GFP (bottom) reporter lines at 48 hpf, showing mCherry and GFP expression in δ- and β-cells, respectively. Scale bars = 50 μm. C: Confocal images showing the endocrine pancreatic domain (dashed line), defined by the cross of the sst:mCherry and ins:GFP reporter lines. The 48-hpf embryos were counterstained with the nuclear marker DAPI. Scale bars = 10 μm. D: Percentage of embryos showing GFP-positive cells within the endocrine domain when injected with a vector containing GFP as reporter gene under the control of the insulin promoter (ins:GFP) (69%, n = 23) or with the Z48 vector without an endocrine enhancer (NC). E: Confocal images from 48-hpf embryos stained with anti-Nkx6.1 antibody (purple) to define the progenitor pancreatic domain (dashed line) in the sst:mCherry reporter line and the nuclear marker DAPI. Scale bars = 10 μm. F: Graph representing the percentage of embryos with GFP expression in progenitor cells when injected with a pancreatic progenitor enhancer (SOX9_PPE) (27%, n = 11) or the NC (0%, n = 43). *P < 0.05, by χ2 test.
|
