|
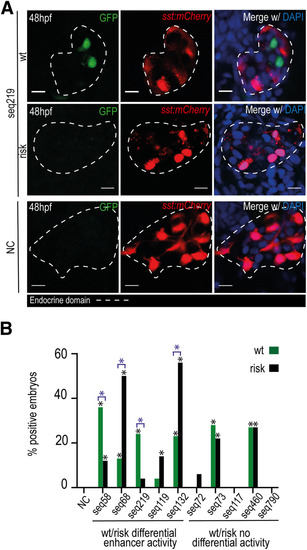
A: Representative confocal images for seq219wt, seq219risk, and NC. Seq219wt showed GFP expression in endocrine pancreatic domain (dashed line), defined by the sst:mCherry reporter line. The 48-hpf embryos were stained with DAPI. Scale bars = 10 µm. B: Graph showing the total percentage of positive embryos in wt and risk alleles for each of the 10 sequences analyzed: seq58wt/risk (36%, n = 56; 12%, n = 43, respectively), seq68wt/risk (13%, n = 47; 50%, n = 32), seq73wt/risk (28%, n = 47; 22%, n = 36), seq132wt/risk (23%, n = 34; 56%, n = 36), seq219wt/risk (24%, n = 38; 6%, n = 35), seq119wt/risk (4%, n = 27; 14%, n = 28), seq72wt/risk (0%, n = 27; 6%, n = 30), seq117wt/risk (0%, n = 21; 0%, n = 8), seq460wt/risk (27%, n = 36; 27%, n = 30), and seq790wt/risk (0%, n = 20; 0%, n = 14). Six sequences showed differential enhancer activity between wt and risk allele. *P < 0.05, by χ2 test.
|