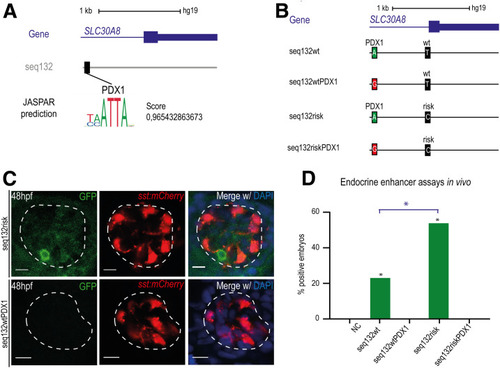
A: PDX1 binding site prediction by JASPAR software. The human SLC30A8 is represented in blue. The vertical black line represents the single nucleotide mutation that overlaps with a PDX1 putative binding site. B: Schematic representation of the analyzed sequences: seq132wt, seq132wtPDX1, seq132risk, and seq132riskPDX1. The wt and risk alleles are discriminated in black boxes and the mutation in red boxes. The green boxes represent the binding site for PDX1. C: Representative confocal images for the analyzed sequence containing the risk variant in the absence (top) of the mutation in the putative binding site for PDX1, showing GFP expression in endocrine pancreatic domain (dashed line) defined by the sst:mCherry reporter line. The sequence containing the wt allele and the mutation (bottom) was not able to drive GFP expression. The 48-hpf embryos were stained with DAPI. Scale bars = 10 μm. D: Graph representing the total percentages of positive embryos for the different sequences represented in panel B: seq132wt (23%, n = 34), seq132wtPDX1 (0%, n = 21), seq132risk (56%, n = 36), and seq132riskPDX1 (0%, n = 20). *P < 0.05, by χ2 test.
|
