IMAGE

Figure 4

ID
ZDB-IMAGE-201208-36
Source
Figures for Eufrásio et al., 2020
Image
Figure Caption

Figure 4

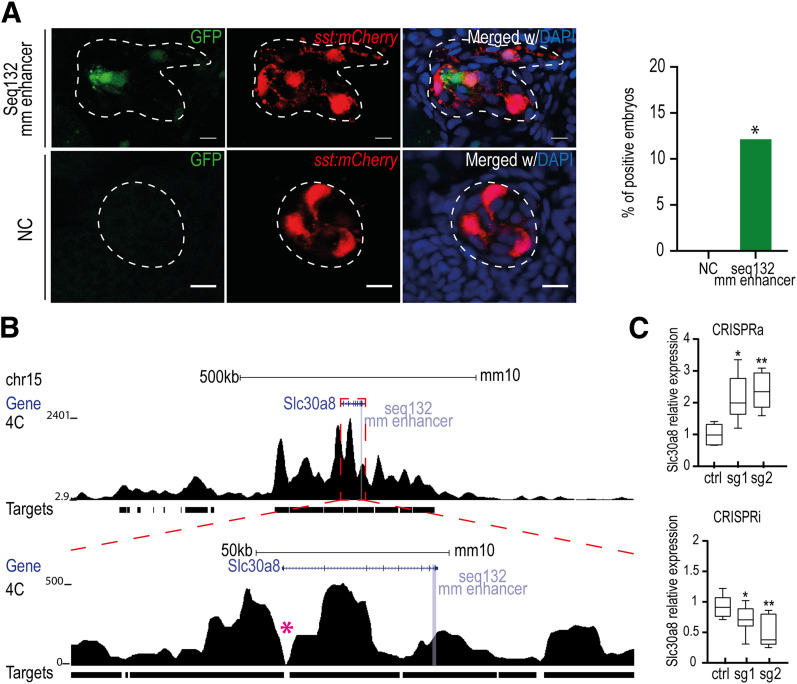
A: Representative confocal images for the mouse seq132 (seq132mm enhancer chr15:52334298 + 52335281). Seq132mm enhancer showed GFP-positive cells within the endocrine pancreatic domain (dashed line) defined by the sst:mCherry reporter line. The 48-hpf embryos were stained with DAPI. Scale bars = 10 μm. Representative graph showing the total percentage of positive embryos for the sequence analyzed (13%, n = 35). *P < 0.05, by χ2 test. B: Genomic landscape of the mouse Slc30a8 gene (blue), showing 4C-seq profiles (black), with view point in Slc30a8 promoter (pink asterisk) in the Min6 cell line; zoom-out (top) and zoom-in (bottom) of the Slc30a8 gene and seq132mm enhancer. The targets line represents the regions where the interaction is significant. C: sgRNAs targeting murine Slc30a8 enhancer in CRISPRa or CRISPR assay in Min6 cells. Slc30a8 expression was calculated relative to the β-actin housekeeping gene by quantitative PCR. Dot blots represent the 10–90% quantile of six biological replicates. *P < 0.05, **P < 0.01. ctrl, control.

Acknowledgments
This image is the copyrighted work of the attributed author or publisher, and ZFIN has permission only to display this image to its users. Additional permissions should be obtained from the applicable author or publisher of the image. Full text @ Diabetes