
- Title
-
Telomere shortening produces an inflammatory environment that increases tumor incidence in zebrafish
- Authors
- Lex, K., Maia Gil, M., Lopes-Bastos, B., Figueira, M., Marzullo, M., Giannetti, K., Carvalho, T., Ferreira, M.G.
- Source
- Full text @ Proc. Natl. Acad. Sci. USA
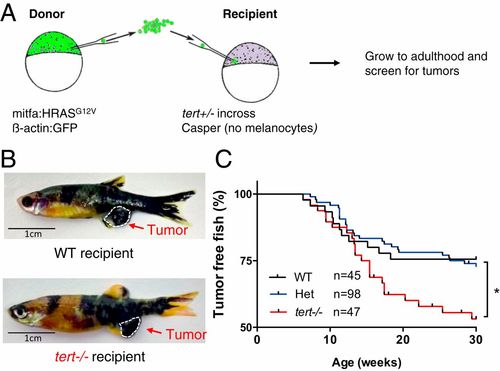
Short telomeres promote tumorigenesis in a noncell autonomous manner. (A) Experimental setup for the generation of zebrafish chimeras. Donor cells are transplanted from a Tg(mitfa:HRASG12V; β-actin:GFP) embryo at the blastula stage into embryos resulting from an in cross of tert+/−; casper zebrafish. (B) Representative images of adult chimera zebrafish harboring melanoma in either WT or tert−/− recipients. (C) Melanoma occurrence over time in chimeric fish. tert−/− recipient fish have a higher risk of tumorigenesis than WT and het recipient fish. *P < 0.05. PHENOTYPE:
|
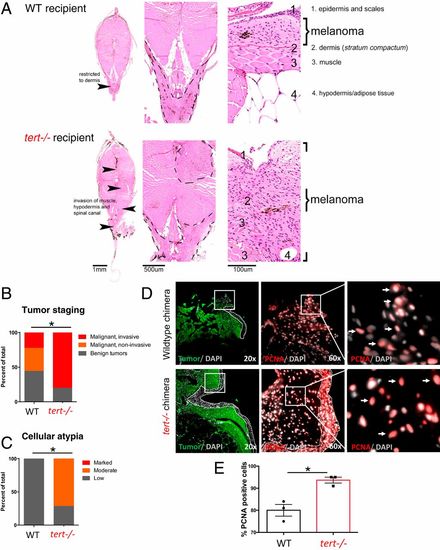
tert−/− tissues increase melanoma invasiveness and progression. (A) Hematoxylin and eosin (H and E) images of melanoma arising in a WT (Upper) or tert−/− recipient fish. Strong infiltration into other tissues was typical in tert−/− fish but not in WT (arrowheads). (B) Melanomas were staged according to histopathology into benign lesions (melanosis), noninvasive and invasive malignant tumors (P = 0.0269; WT n = 9; tert−/− n = 10). (C) Analysis of malignant tumors for cellular atypia (P = 0.0278; WT n = 5; tert−/− n = 7). (D) Representative immunofluorescence images of PCNA-positive cells (red) in melanoma (green) developed in WT chimeras and in tert−/− chimeras. Dashed lines locate the skin (no green fluorescence), squares show the place of amplification, and arrows indicate PCNA-positive cells. (E) Quantification of PCNA-positive melanoma cells in WT and tert−/− chimeras. Data are represented as mean ± SEM. *P < 0.05; n = 3. PHENOTYPE:
|
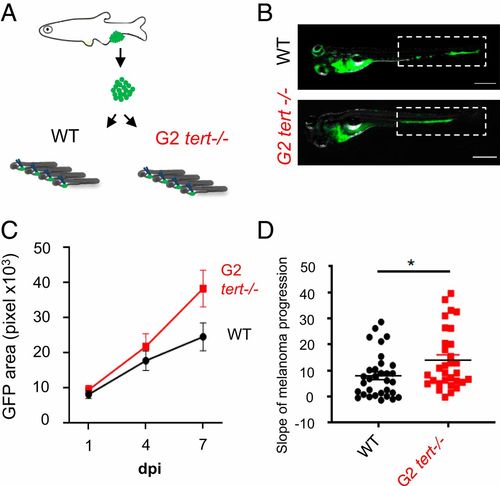
G2 tert−/− larvae with very short telomeres exhibit increased melanoma expansion. (A) Experimental design for melanoma allotransplants in zebrafish larvae. Melanoma tumors were dissected from Tg(mitfa:HRASG12V; β-actin:GFP) zebrafish and cells dissociated. HRAS melanoma cells were then injected into blood circulation of 2-dpf zebrafish larvae. Larvae were kept for 7-d-postinjection (7-dpi). (B) Representative images of HRAS melanoma cells spread (green) in WT or G2 tert−/− larvae at 7 dpi. (Scale bars: 0.5 mm.) (C) Time course of HRAS melanoma cells spread in a group of WT and G2 tert−/− larvae (P < 0.01 at 7 dpi; WT n = 10; G2 tert−/− n = 11). (D) Melanoma tumors are more disseminated in G2 tert−/− larvae (*P < 0.05; WT n = 32; G2 tert−/− n = 31). A linear regression of three time points (1, 4, and 7 dpi) was used to calculate the slope of melanoma expansion over time. Each dot represents one larvae allotransplant. |
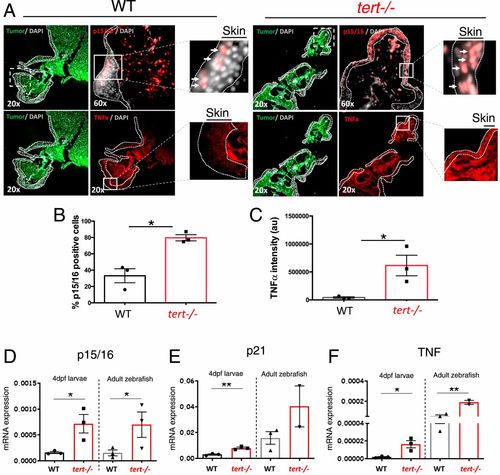
tert −/− tissues present increased levels of senescence (p15/16) and inflammation (TNF-α). (A) Representative immunofluorescence images of p15/16 and TNF-α in the skin near melanoma in chimeric WT and tert−/− zebrafish. Dashed lines locate the skin (no green fluorescence), and arrows indicate p15/16-positive cells. Squares with dashed lines show place of amplification in a sequential section, and squares with solid lines show place of amplification on that section. (B and C) Quantification of p15/16-positive cells and levels of TNF-α, respectively, in the skin of chimeric WT and tert−/− zebrafish (n = 3). (D–F) RT-qPCR analysis comparing the expression levels of cdkn2a/b (p15/16), cdkn1a (p21), and tnfa (TNF) of 4-dpf WT, G2 tert−/− larvae, 9-months WT, and tert−/− adult intestine tissue. Data are represented as mean ± SEM. (*P < 0.05; **P < 0.01 for n = 30). |
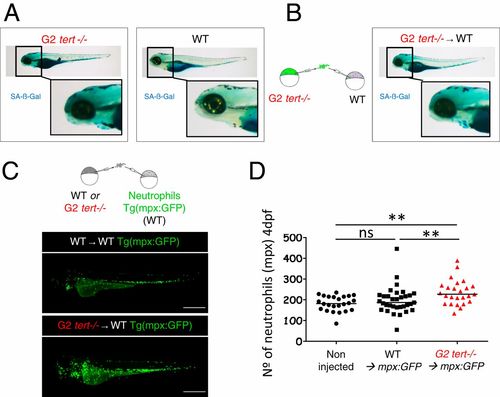
G2 tert mutant cells induce high levels of senescence and systemic inflammation in host larvae. (A) Representative images of SA-β-Gal assay comparing WT and G2 tert−/− 4-dpf zebrafish embryos. Yolk sack staining is nonspecific. (B, Left) Scheme of chimera generation: G2 tert−/− blastula cells are transplanted into WT embryos (G2 tert−/− → WT). (B, Right) Marked senescence in 4-dpf WT embryos upon G2 tert−/− cell injection (C, Left) Scheme of chimera generation: WT or G2 tert−/− blastula cells transplanted into WT Tg(mpx:GFP) embryos with GFP-labeled neutrophils: WT → WT Tg(mpx:GFP) vs. G2 tert−/− → WT Tg(mpx:GFP). (C, Right) Representative images at 4 dpf, and neutrophils are shown in green. (Scale bars: 0.5 mm.) (D) Quantification of neutrophils at 4 dpf. Noninjected Tg(mpx:GFP) were used as controls. Each data point represents one zebrafish (**P > 0.01; noninjected n = 24; WT n = 33; tert−/− n = 25; ns, nonsignificant [P > 0.05]). |
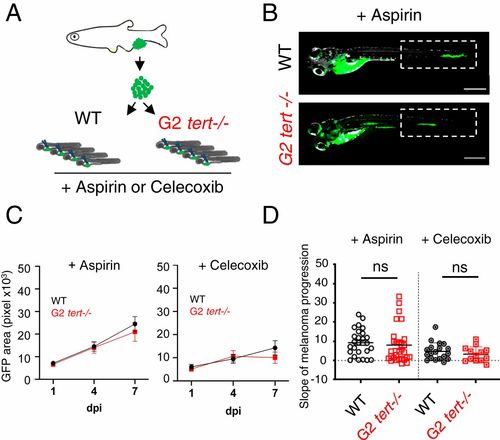
Increased tumor expansion in G2 tert−/− larvae is rescued by inflammation inhibition. (A) Allotransplants of primary tumor cells extracted from melanoma in adult fish into 2-dpf larvae that were treated with aspirin or Celecoxib (COX-2 selective inhibitor). (B) Representative images of melanoma expansion at 7 dpi upon aspirin treatment. (Scale bars: 0.5 mm.) (C) Time course of melanoma dissemination in WT and G2 tert−/− larvae under aspirin treatment. (D) Slope of HRAS melanoma spread among 1, 4, and 7 dpi. Comparison of tumor cell expansion in a WT or G2 tert−/− treated with aspirin (WT n = 26 and G2 tert−/− n = 29) or Celecoxib (WT n = 19 and G2 tert−/− n = 13). Each dot represents one larva allotransplant. ns, nonsignificant (P > 0.05). |