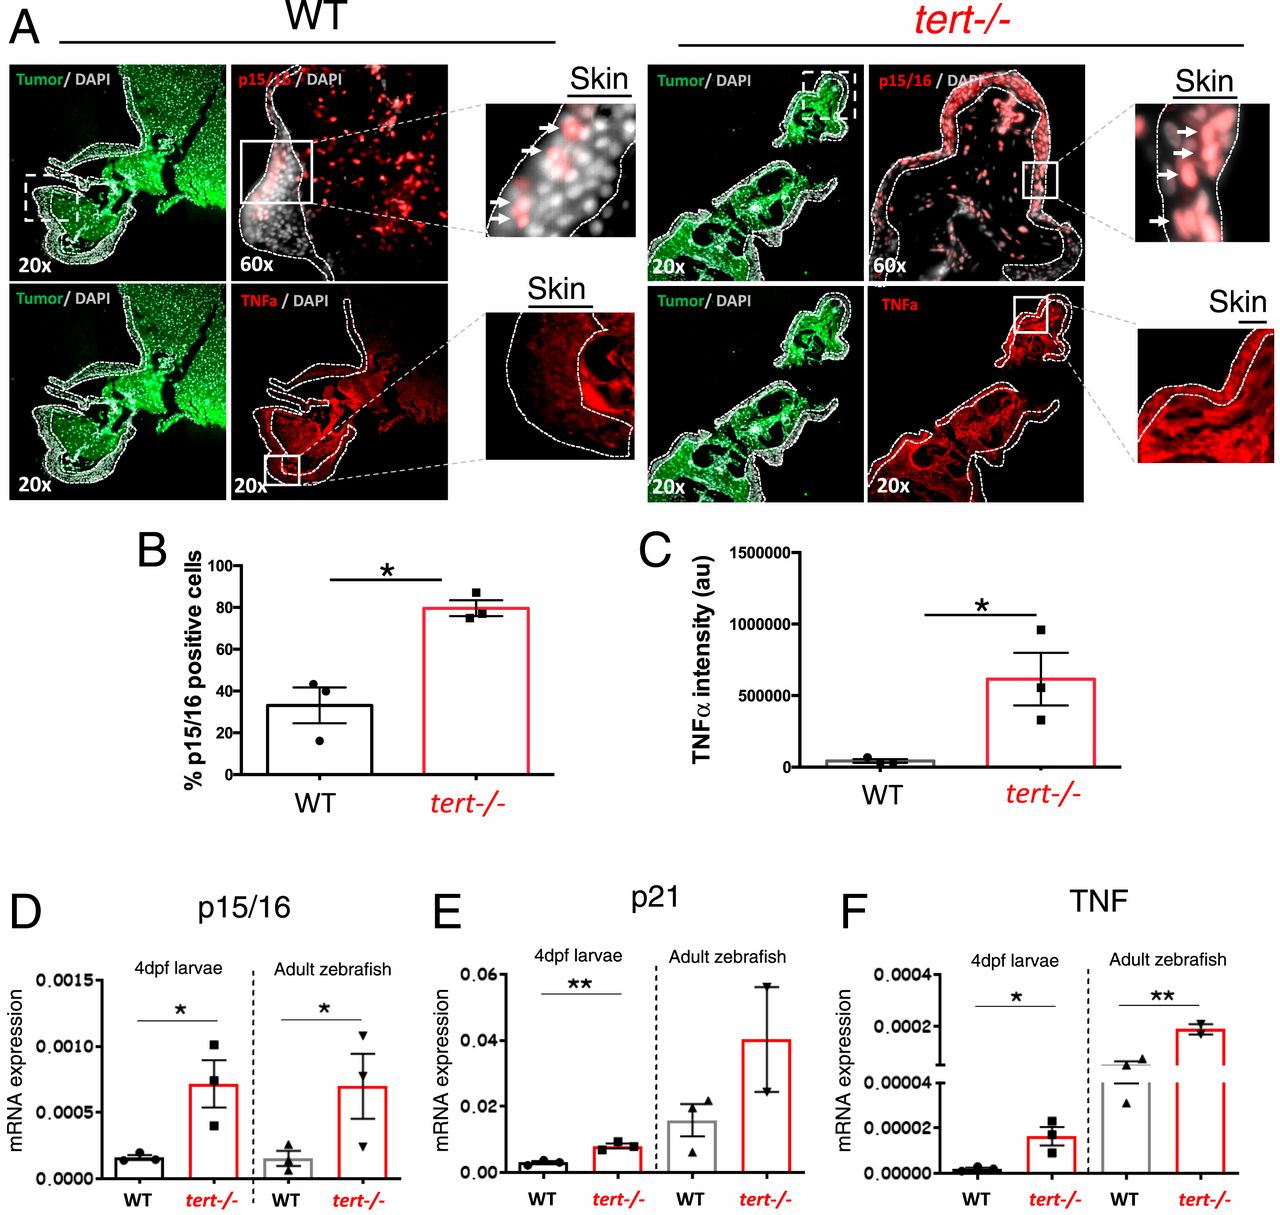
Fig. 4 tert −/− tissues present increased levels of senescence (p15/16) and inflammation (TNF-α). (A) Representative immunofluorescence images of p15/16 and TNF-α in the skin near melanoma in chimeric WT and tert−/− zebrafish. Dashed lines locate the skin (no green fluorescence), and arrows indicate p15/16-positive cells. Squares with dashed lines show place of amplification in a sequential section, and squares with solid lines show place of amplification on that section. (B and C) Quantification of p15/16-positive cells and levels of TNF-α, respectively, in the skin of chimeric WT and tert−/− zebrafish (n = 3). (D–F) RT-qPCR analysis comparing the expression levels of cdkn2a/b (p15/16), cdkn1a (p21), and tnfa (TNF) of 4-dpf WT, G2 tert−/− larvae, 9-months WT, and tert−/− adult intestine tissue. Data are represented as mean ± SEM. (*P < 0.05; **P < 0.01 for n = 30).
Image
Figure Caption
Figure Data
Acknowledgments
This image is the copyrighted work of the attributed author or publisher, and
ZFIN has permission only to display this image to its users.
Additional permissions should be obtained from the applicable author or publisher of the image.
Full text @ Proc. Natl. Acad. Sci. USA

