
- Title
-
A Comprehensive Study of High Cholesterol Diet-Induced Larval Zebrafish Model: A Short-Time In Vivo Screening Method for Non-Alcoholic Fatty Liver Disease Drugs
- Authors
- Ma, J., Yin, H., Li, M., Deng, Y., Ahmad, O., Qin, G., He, Q., Li, J., Gao, K., Zhu, J., Wang, B., Wu, S., Wang, T., Shang, J.
- Source
- Full text @ Int. J. Biol. Sci.
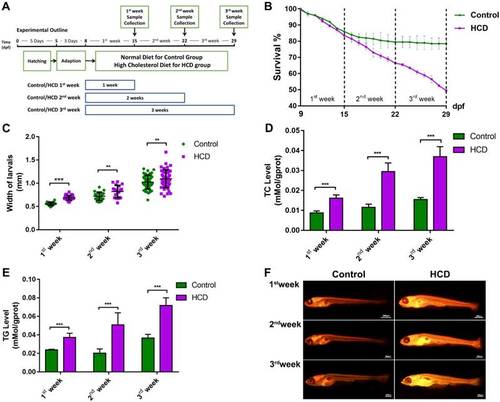
Effect of high cholesterol diet on metabolic profiles and lipid accumulation in larval zebrafish. (A) Experimental outline of HCD induced NAFLD larval zebrafish. (B) Survival rate of larval zebrafish (n=3). (C) Width changes of larval zebrafish (D) TC level of larval zebrafish (n=6). (E) TG level of larval zebrafish(n=6). (F) Nile red stain of larval zebrafish. Bar indicate means ± SD. n.s. P >0.05, *P <0.05, **P <0.01, ***P<0.001 represent significance of difference, P<0.05 was considered as statistically significant. Significant was calculated by ANOVA followed by turkey's test. n indicates the replicates of experiment.
PHENOTYPE:
|
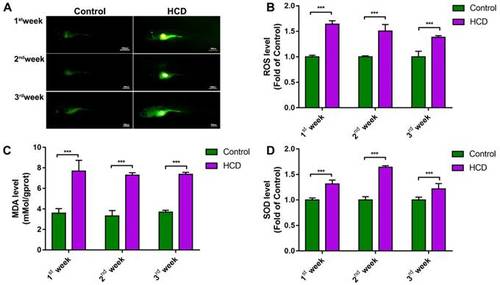
Effect of high cholesterol diet on metabolic oxidant stress in larval zebrafish. (A) ROS production of Larval zebrafish stained by DCFH-DA and captured by fluorescence stereoscope (B) Quantitation of ROS level (n=6). (C) MDA level of larval zebrafish (n=6) (D) SOD activity of larval zebrafish (n=6). Bar indicate means ± SD. ***P<0.001 represent significance of difference, P<0.05 was considered as statistically significant. Significant was calculated by ANOVA followed by turkey's test. n indicates the replicates of experiment.
PHENOTYPE:
|

Effect of high cholesterol diet on hepatic steatosis in larval zebrafish. (A)Oil red O staining of larval zebrafish, the hepatic steatosis was point out with yellow circle. (B) HE staining of larval zebrafish liver, macrovesicular steatosis, possible fibrosis feature and ballooning degeneration were point out with red arrows. (C) Macrovesicular steatosis area percentage of larval zebrafish liver (evaluated by 6 experts).
PHENOTYPE:
|
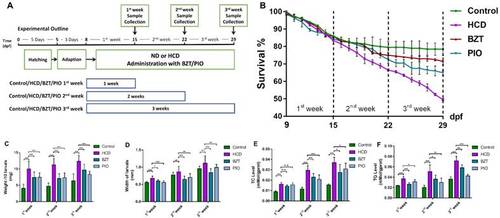
Evaluation of HCD induced larval zebrafish models by bezafibrate and pioglitazone treatments. (A) Experimental outline of NAFLD larval zebrafish with BZT and PIO administration groups. (B) Survival rate of larval zebrafish (n=3). (C) weight changes of larval zebrafish (D) Width changes of larval zebrafish. (E)TC level of larval zebrafish (n=6). (F) TG level of larval zebrafish (n=6). Bar indicate means ± SD. n.s.P >0.05, *P <0.05, **P <0.01, ***P<0.001 represent significance of difference, P<0.05 was considered as statistically significant. Significant was calculated by ANOVA followed by turkey's test. n indicates the replicates of experiment. PHENOTYPE:
|
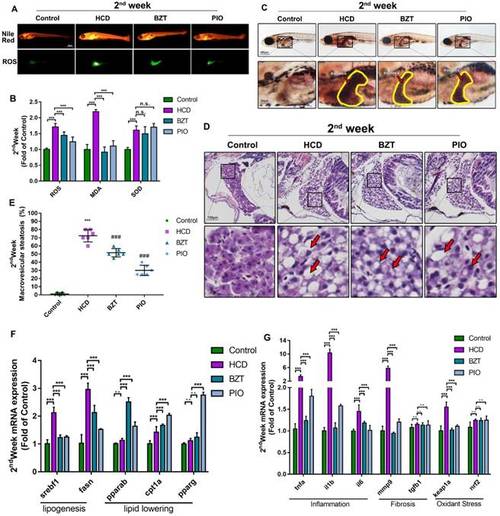
Further evaluation of HCD induced 2 weeks larval zebrafish model by bezafibrate and pioglitazone treatments. (A) Nile red stain and ROS production of Larval zebrafish. (B) Oxidant stress index of ROS, MDA, and SOD of larval zebrafish (n=6). (C) Oil red O staining of larval zebrafish, the hepatic steatosis was point out with yellow circle. (D) HE staining of larval zebrafish liver, macrovesicular steatosis, and microvesicular steatosis were point out with red arrows. (E) Macrovesicular steatosis area percentage of larval zebrafish liver (evaluated by 6 experts). (F)mRNA expression of lipogenesis and lipid-lowering of larval zebrafish (n=6). (G) mRNA expression of inflammation, Fibrosis and oxidant stress of larval zebrafish (n=6). Bar indicate means ± SD. n.s.P >0.05, ***P<0.001 represent significance of difference, P<0.05 was considered as statistically significant. Significant was calculated by ANOVA followed by turkey's test. n indicates the replicates of experiment. EXPRESSION / LABELING:
PHENOTYPE:
|
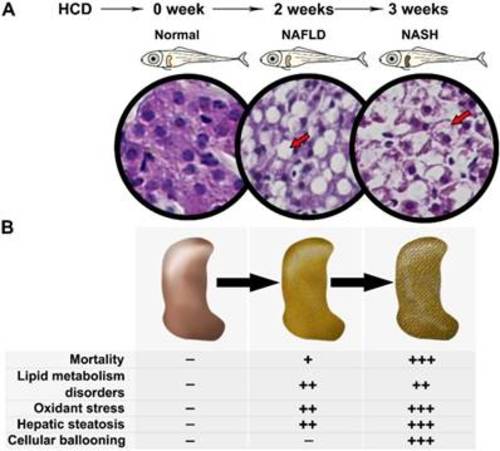
Spectrum of NAFLD on HCD induced larval zebrafish. (A) Processing of NAFLD on Larval zebrafish. (B) Multiple aspects changes in processing of NAFLD on Larval zebrafish.
|