|
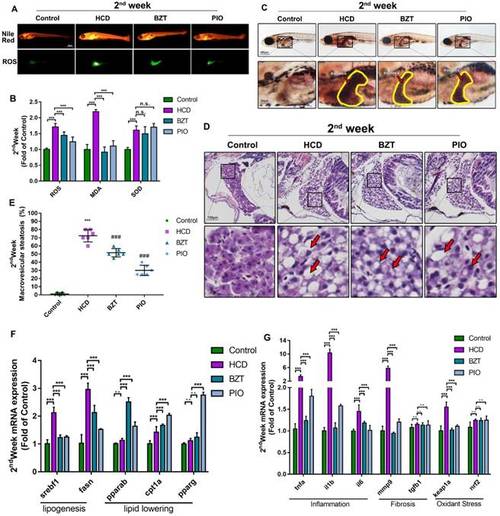
Further evaluation of HCD induced 2 weeks larval zebrafish model by bezafibrate and pioglitazone treatments. (A) Nile red stain and ROS production of Larval zebrafish. (B) Oxidant stress index of ROS, MDA, and SOD of larval zebrafish (n=6). (C) Oil red O staining of larval zebrafish, the hepatic steatosis was point out with yellow circle. (D) HE staining of larval zebrafish liver, macrovesicular steatosis, and microvesicular steatosis were point out with red arrows. (E) Macrovesicular steatosis area percentage of larval zebrafish liver (evaluated by 6 experts). (F)mRNA expression of lipogenesis and lipid-lowering of larval zebrafish (n=6). (G) mRNA expression of inflammation, Fibrosis and oxidant stress of larval zebrafish (n=6). Bar indicate means ± SD. n.s.P >0.05, ***P<0.001 represent significance of difference, P<0.05 was considered as statistically significant. Significant was calculated by ANOVA followed by turkey's test. n indicates the replicates of experiment.
|