
|
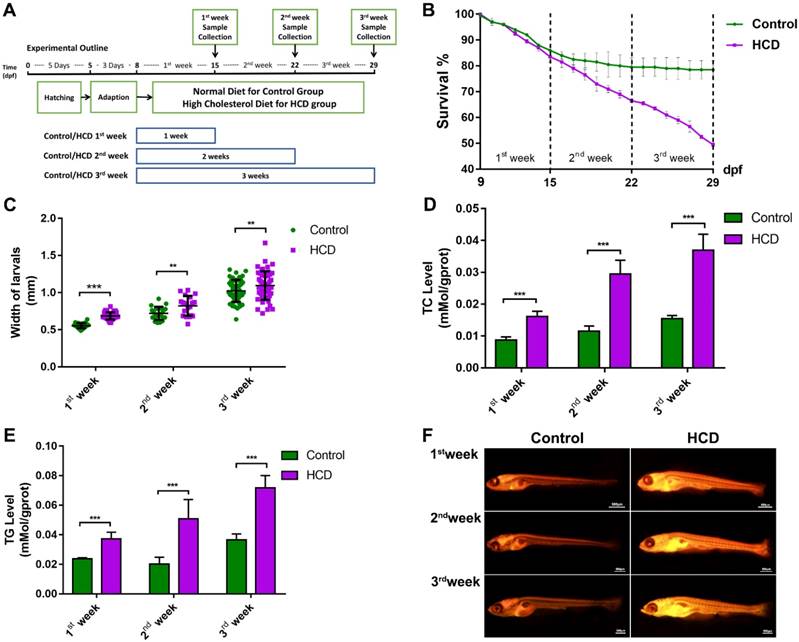
Fig. 1
Effect of high cholesterol diet on metabolic profiles and lipid accumulation in larval zebrafish. (A) Experimental outline of HCD induced NAFLD larval zebrafish. (B) Survival rate of larval zebrafish (n=3). (C) Width changes of larval zebrafish (D) TC level of larval zebrafish (n=6). (E) TG level of larval zebrafish(n=6). (F) Nile red stain of larval zebrafish. Bar indicate means ± SD. n.s. P >0.05, *P <0.05, **P <0.01, ***P<0.001 represent significance of difference, P<0.05 was considered as statistically significant. Significant was calculated by ANOVA followed by turkey's test. n indicates the replicates of experiment.