
|
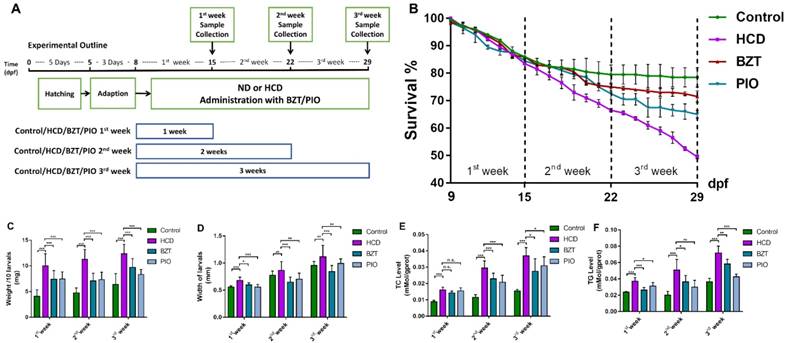
Fig. 4
Evaluation of HCD induced larval zebrafish models by bezafibrate and pioglitazone treatments. (A) Experimental outline of NAFLD larval zebrafish with BZT and PIO administration groups. (B) Survival rate of larval zebrafish (n=3). (C) weight changes of larval zebrafish (D) Width changes of larval zebrafish. (E)TC level of larval zebrafish (n=6). (F) TG level of larval zebrafish (n=6). Bar indicate means ± SD. n.s.P >0.05, *P <0.05, **P <0.01, ***P<0.001 represent significance of difference, P<0.05 was considered as statistically significant. Significant was calculated by ANOVA followed by turkey's test. n indicates the replicates of experiment.