
- Title
-
TETs Regulate Proepicardial Cell Migration through Extracellular Matrix Organization during Zebrafish Cardiogenesis
- Authors
- Lan, Y., Pan, H., Li, C., Banks, K.M., Sam, J., Ding, B., Elemento, O., Goll, M.G., Evans, T.
- Source
- Full text @ Cell Rep.
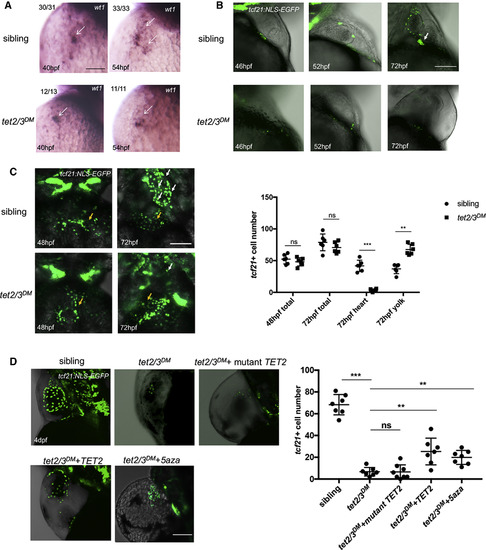
tet2 and tet3 Have Overlapping Functions in PE Recruitment to the Heart (A) WISH for PE marker wt1 at 40 hpf and 54 hpf. Arrows indicate PE cells with wt1transcripts. (B) Lateral view of hearts showing GFP-labeled PE and epicardium in 46-hpf, 52-hpf, and 72-hpf larvae carrying the Tg(tcf21:NLS-EGFP) transgene. White arrow indicates the extracellular matrix bridge between AVC and the pericardial wall. (C) Ventral view of hearts showing GFP-labeled PE and epicardium in 48-hpf and 72-hpf sibling or tet2/3DM larvae carrying the Tg(tcf21:NLS-EGFP) transgene. White arrows indicate tcf21+ PE and epicardial cells located on the heart. Yellow arrows indicate tcf21+ PE and epicardial cells located on the yolk sac. Graph indicates the total number of PE and epicardial cells in 48-hpf or 72-hpf sibling and tet2/3DMlarvaeand the number of PE and epicardial cells located on heart or yolk sac at 72-hpf sibling and tet2/3DM larvae. (D) The PE migration defect is partially rescued by TET2 mRNA injection or 5-aza treatment. GFP-labeled PE and epicardium in 4-dpf sibling, tet2/3DM, and tet2/3DMinjected with wild-type hTET2 mRNA, mutant hTET2 mRNA, or tet2/3DM exposed to 75 μM 5-aza larvae carrying the Tg(tcf21:NLS-EGFP) transgene. Graph indicating the number of epicardial cells located on the heart at 4 dpf is shown. Scale bars: (A) 50 μm; (B–D) 100 μm. ∗∗p < 0.01; ∗∗∗p < 0.001; ns indicates not significant. Data are presented as mean ± SD derived from at least three independent biological replicates EXPRESSION / LABELING:
|
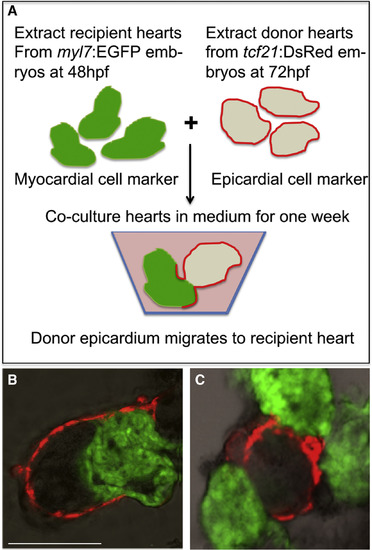
Epicardial Cells from Donor Hearts Do Not Migrate onto tet2/3DM Recipient Hearts (A) Schematic of epicardial cell migration assay. Wild-typetcf21:DsRed donor hearts (isolated at 72 hpf) were co-cultured with either wild-type or tet2/3DM myl7:GFP recipient hearts (isolated at 48 hpf) for one week and then confocal images taken. (B) Confocal images showed epicardial cells from wild-type donor heart can migrate onto wild-type recipient hearts. In 30 pairs of co-cultured hearts, 6 of recipient hearts were observed having epicardial cells migrated from donor hearts. (C) Confocal images showed epicardial cells from wild-type donor heart failed to migrate onto tet2/3DM recipient hearts. In 60 pairs of co-cultured hearts, none of the recipient hearts were observed having epicardial cells from donor hearts. Scale bar: 50 μm. |

ZFIN is incorporating published figure images and captions as part of an ongoing project. Figures from some publications have not yet been curated, or are not available for display because of copyright restrictions. PHENOTYPE:
|
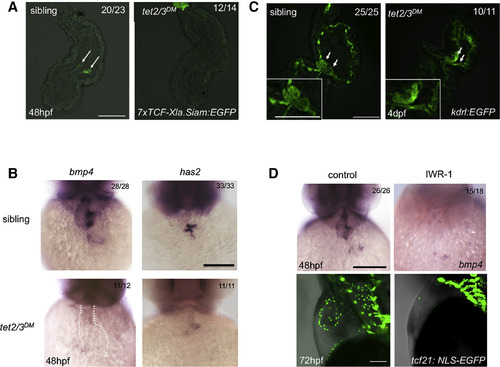
AVC Development Shows Disruption in tet2/3DMLarvae (A) GFP-labeled AVC endocardium represents Wnt activity in sibling heart, but not tet2/3DM heart. Hearts were dissected from 48-hpf larvae carrying the Tg(7xTCF-Xla.Siam:GFP) transgene. White arrows indicate AVC endocardial cells with Wnt activity. (B) WISH for AVC markers bmp4 and has2 at 48 hpf. (C) GFP-labeled endocardium represents AV valve formation in 4-dpf sibling, but not tet2/3DM larvae carrying the Tg(kdrl:EGFP) transgene. White arrows indicate the AV valve. Bottom left images show higher magnification views of AV valve regions. (D) WISH for AVC marker bmp4 in 48 hpf and confocal imaging for GFP-labeled PE and epicardium in 72-hpf control and IWR-1-treated larvae. Scale bars: 50 μm. |
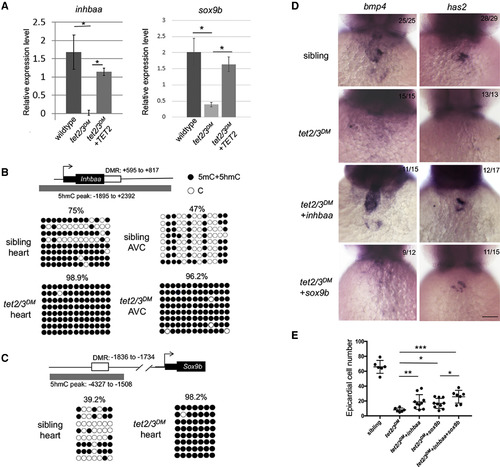
Tet2/3-Dependent Aberrant Promoter Hypermethylation and Deregulation of inhbaa and sox9bLeads to AVC and PE Migration Defects (A) RT-PCR analysis of inhbaa and sox9b transcripts in 48-hpf embryonic heart. (B) DNA methylation status of inhbaa in 48-hpf isolated heartor isolated AVC. Diagram indicates inhbaa locus and the associated regulatory regions. Gray box represents 5hmC peak. Black box represents the coding sequence. White box represents hyper-DMR identified by ERRBS. Profiles of 5mC + 5hmC in hyper-DMR region were validated by bisulfite sequencing. n = 4 per condition. (C) DNA methylation status of sox9b in 48 hpf isolated heart. Diagram indicates sox9b locus and the associated regulatory regions. Gray box represents 5hmC peak. Black box represents the coding sequence. White box represents hyper-DMR. Profiles of 5mC + 5hmC in hyper-DMR region were validated by bisulfite sequencing. n = 4 per condition. (D) WISH for AVC markers bmp4 and has2 at 48-hpf sibling, tet2/3DM, and tet2/3DM injected with inhbaa mRNA or sox9bmRNA larvae. Scale bar: 50 μm. (E) Number of epicardial cells on the heart of 4-dpf sibling, tet2/3DM, and tet2/3DM injected with inhbaa mRNA, sox9bmRNA, or sox9b combined with inhbaa mRNA larvae carrying the Tg(tcf21:NLS-EGFP) transgene. Data are presented as the mean ± SD. The significance is indicated as ∗p < 0.05; ∗∗p < 0.01; ∗∗∗p < 0.001; ns indicates not significant. |
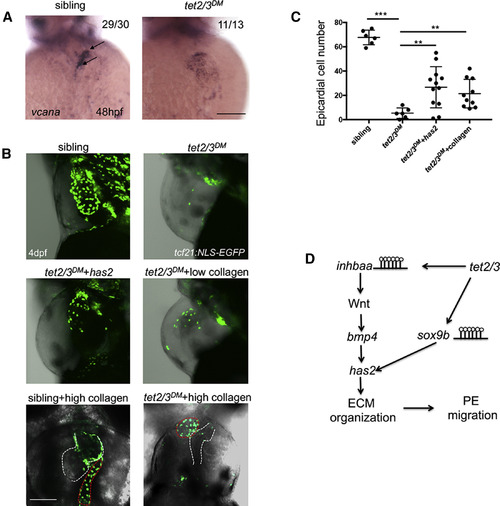
Tet2/3 Regulate PE Migration through Extracellular Matrix Organization (A) WISH for ECM constituent gene vcana at 48 hpf. Black arrows indicate AVC-specific expression of vcana in sibling, but not tet2/3DM heart. (B) GFP-labeled PE and epicardium in 4-dpf larvae carrying the Tg(tcf21:NLS-EGFP) transgene. Sibling, tet2/3DM, and tet2/3DMinjected with has2 mRNA and tet2/3DM injected with low concentration (0.5 mg/mL) collagen larvae were shown in lateral views. Sibling and tet2/3DM injected with high concentration (8 mg/mL) collagen larvae were shown in ventral views to represent collagen aggregate and heart clearly. The heart is outlined with white dashed line. The collagen aggregate is outlined with red dashed line. (C) Number of epicardial cells on the heart of 4-dpf sibling, tet2/3DM, and tet2/3DM injected with sox9b mRNA or tet2/3DMinjected with low concentration (0.5 mg/mL) collagen larvae carrying the Tg(tcf21:NLS-EGFP) transgene. Numbers data are presented as the mean ± SD derived from 3 independent biological replicates. (D) Working model shows Tet2/3-dependent demethylation regulates the expression of inhbaa and sox9b, which subsequently regulate AVC ECM organization and PE migration. Scale bars: 50 μm. The significance is indicated as ∗p < 0.05; ∗∗p < 0.01; ∗∗∗p < 0.001 |
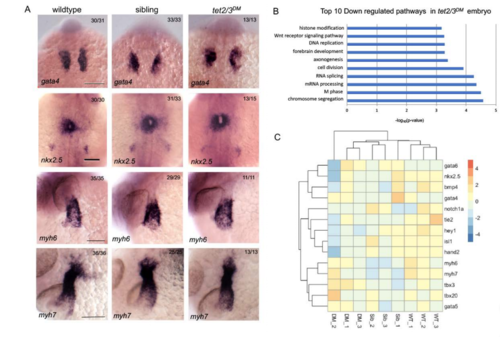
tet2/3DM Larvae Show Neuronal but not Cardiac Defects at 28 hpf. Related to Figure 1. (A) Markers of cardiac progenitors are similarly expressed in wildtype, sibling and tet2/3DM larvae. WISH forgata4 was performed at 18 hpf, nkx2.5 was performed at 22-hpf, atrial myosin marker myh6 and myosin marker myh7 were performed at 28-hpf. Scale bar: 100 μm. DM (C) Heatmap of RNA sequencing data illustrating similar transcriptional expression of cardiac genes in tet2/3(DM) compared with wildtype (WT) or sibling (Sib) larvae. DM |
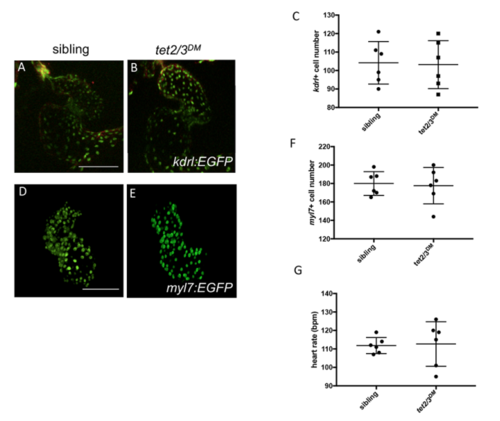
Normal Myocardium and Endocardium in 2-dpf tet2/3DM Larvae. Related to Figure 1. |
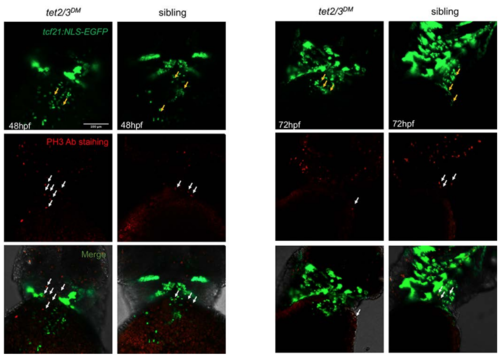
No PE Cell Proliferation at 48 and 72 hpf Sibling and tet2/3DM Larvae. Related to Figure 1.Confocal images showing sibling and tet2/3DM larvae carrying the Tg(tcf21:NLS-EGFP) transgene stained by anti-GFP antibody (Green) plus anti-pH3 antibody (Red). Yellow arrows indicate PE cells. White arrows indicate pH3+ proliferating cells. Co-staining shows essentially no cell proliferation of tcf21+ PE cells at 48-hpf or 72-hpf. Scale bar: 100 μm. |
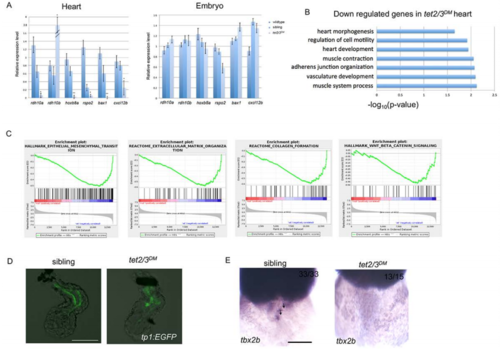
tet2/3DM Larvae Show Cardiac AVC Defects at 48-hpf. Related to Figure 3 and Figure 4. (C) Gene set enrichment analysis shows down-regulated biological pathways in 48-hpf tet2/3DM hearts compared to wildtype hearts by RNA sequencing using isolated hearts. |
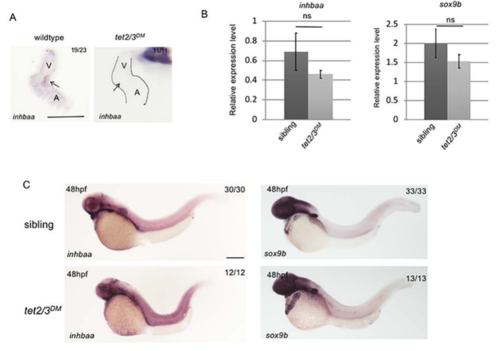
inhbaa and sox9b Expression Shows Cardiac Specific Defects in tet2/3DM Larvae. Related to Figure 5. (B) RT-PCR analysis of inhbaa and sox9b transcripts in representative 48-hpf embryos. (C) WISH for inhbaa and sox9b in representative 48-hpf embryos. Scale bar: 300 μm. |
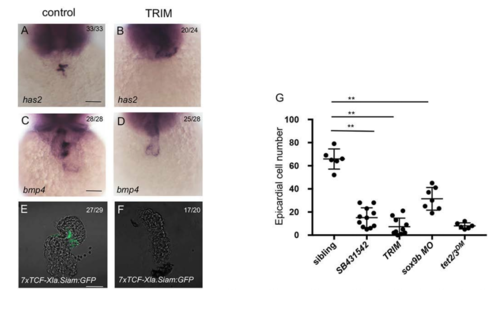
Inhibiting the Activin-A Pathway or sox9b Causes AVC Disruption and PE Migration Defect. Related to Figure 5. (G) Number of epicardial cells in the heart of 4-dpf sibling, sibling exposed to SB431542 or TRIM from 24 hpf,sox9b morphant and tet2/3DM larvae carrying the Tg(tcf21:NLS-EGFP) transgene. Data are presented as the mean ± SD. The significance is indicated as **P < 0.01. |