
|
Fig. S2
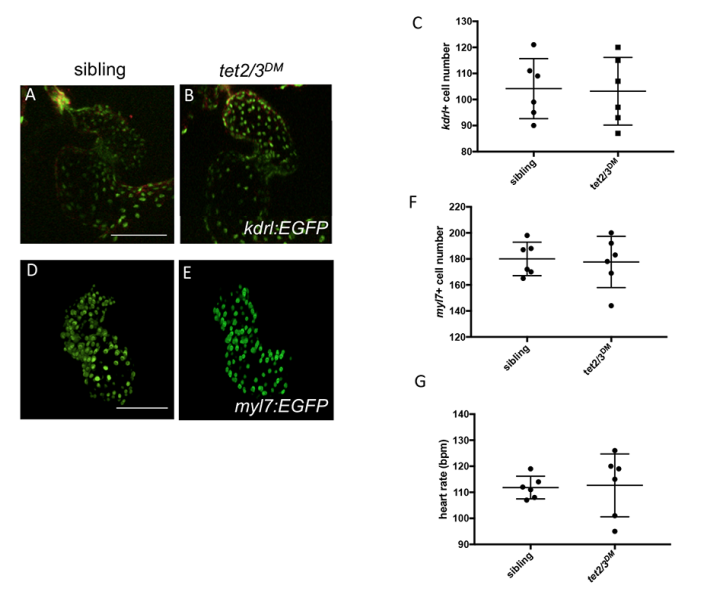
Normal Myocardium and Endocardium in 2-dpf tet2/3DM Larvae. Related to Figure 1.
(A and B) GFP labeled endocardium in 2-dpf larvae carrying the Tg(kdrl:EGFP-NLS) transgene.
(C) Graph indicates the number of endocardial cells in 48-hpf sibling and tet2/3DM larvae. Data are presented as the mean ± SD.
(D and E) GFP labeled myocardium in 2-dpf larvae carrying the Tg(myl7:EGFP) transgene.
(F) Graph indicates the number of myocardial cells in 48-hpf sibling and tet2/3DM larvae. Data are presented as the mean ± SD.
(G) Graph indicates heart rate in 48-hpf sibling and tet2/3DM larvae. Heart rate was measured in beats per minute. Data are presented as the mean ± SD.
Scale bars: 100 μm.