
- Title
-
Genome-wide analysis of facial skeletal regionalization in zebrafish
- Authors
- Askary, A., Xu, P., Barske, L., Bay, M., Bump, P., Balczerski, B., Bonaguidi, M.A., Crump, J.G.
- Source
- Full text @ Development
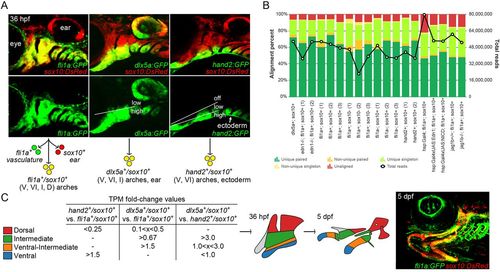
Isolation of arch CNCCs for RNAseq. (A) Cells were sorted using transgenic lines that label different populations of arch CNCCs. fli1a:GFP and sox10:DsRed overlap throughout arch CNCCs (yellow); dlx5a:GFP and sox10:DsRed in CNCCs of ventral (V) to intermediate (I) domains, as well as some dorsal (D) domain CNCCs and the otic vesicle; and hand2:GFP and sox10:DsRed in ventral and more weakly in ventral-intermediate (VI) CNCCs [modified from Barske et al. (2016) and Medeiros and Crump (2012)]. (B) Breakdown of alignment results for each RNAseq experiment, showing the percentage of reads aligned to a unique site in the genome and whether both paired-end reads were aligned. The line graph shows the total number of reads acquired for each sample. (C) Dorsal, intermediate, ventral-intermediate, and ventral domains were defined by their relative enrichment levels (i.e. fold-change of TPM values) among hand2:GFP; sox10:DsRed, dlx5a:GFP; sox10:DsRed, and fli1a:GFP; sox10:DsRed cells. These domains correspond to specific parts of the arches at 36 hpf that give rise to the larval craniofacial skeleton at 5 dpf (shown for context in a fli1a:GFP; sox10:DsRed fish). |
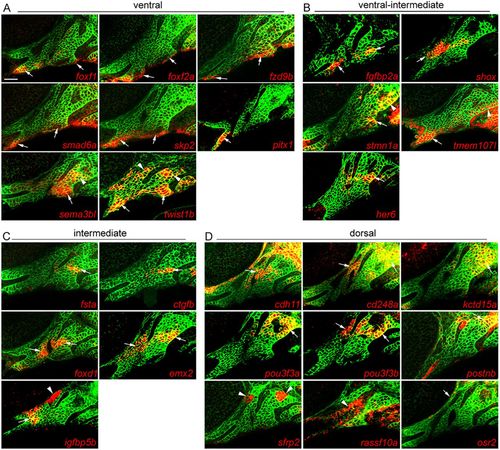
Arch expression of predicted domain-specific genes. Whole-mount fluorescent in situ hybridizations for select genes were performed in sox10:GFPCAAX embryos at 36 hpf, with anti-GFP staining (green) showing CNCCs of the mandibular and hyoid arches. (A) foxf1, foxf2a, fzd9b, smad6a and skp2 are expressed in ventral domains of both arches, pitx1 only in the ventral mandibular arch, and sema3bl and twist1b in ventral and dorsal CNCCs. (B) fgfbp2a and shox are expressed in ventral-intermediate CNCCs, stmn1a in ventral-intermediate and dorsal CNCCs, tmem107I in ventral mandibular and posterior dorsal hyoid arches, and her6 in a more dorsal domain. (C) fsta, ctgfb, foxd1, emx2 and igfbp5b show specific intermediate domain expression; igfbp5b is also expressed in arch mesoderm. (D) cdh11, cd248a, kctd15a, pou3f3a, pou3f3b and postnb are expressed in dorsal CNCCs, sfrp2 in dorsal arch mesoderm, rassf10a in epithelia, and osr2 between the dorsal first arch and eye. Arrows point to expression in predicted domains, and arrowheads to other arch domains. Single optical sections are shown. Scale bar: 20 μm. EXPRESSION / LABELING:
|
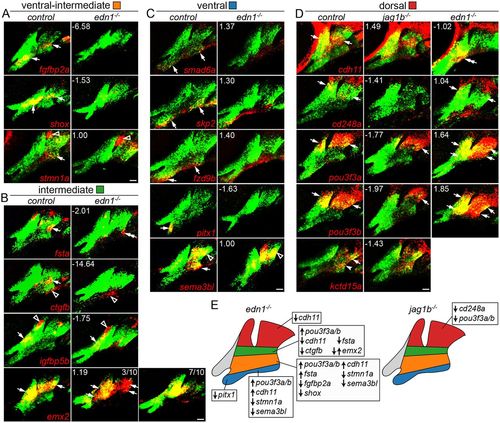
Changes in domain-specific gene expression in edn1 and jag1b mutants. Two-color fluorescent in situ hybridizations were performed for genes of interest (red) and dlx2a (green) to label arch CNCCs at 36 hpf. Numbers indicate the gene expression fold-change in mutant versus wild-type fli1a:GFP+; sox10:dsRed+ CNCCs as determined by RNAseq. Maximum intensity projections show the mandibular (left) and hyoid (right) arches. (A) The ventral-intermediate expression of fgfbp2a, shox and stmn1a is lost in edn1 mutants, yet pouch expression of stmn1a is unaffected. (B) In edn1 mutants, intermediate expression of fsta and ctgfb is lost, emx2 is variably upregulated or downregulated, and CNCC and mesoderm expression of igfbp5b is unaltered. We also note some ectopic ventral hyoid fsta expression in edn1 mutants. (C) Ventral expression of smad6a, skp2 and fzd9b is normal in edn1 mutants, yet ventral expression of pitx1 and sema3bl is lost. Note that dorsal expression of sema3bl is unaffected. (D) In jag1b mutants, dorsal expression of cd248a is lost, pou3f3a and pou3f3b are reduced, and cdh11 and kctd15a are unaffected. In edn1 mutants, cdh11 expression shifts to ventral CNCCs, pou3f3a and pou3f3b are ectopically expressed in ventral CNCCs, and cd248a is largely unaffected. Arrows indicate expression in predicted arch domains, open arrowheads indicate additional expression domains, and double arrows show expansion into other CNCC domains in mutants. Unless stated otherwise, consistent expression patterns were seen in a minimum of three wild types and three mutants for each experiment. Scale bars: 20 μm. (E) Summary of verified gene expression changes in edn1 and jag1b mutants. Unaffected genes are not listed. EXPRESSION / LABELING:
PHENOTYPE:
|
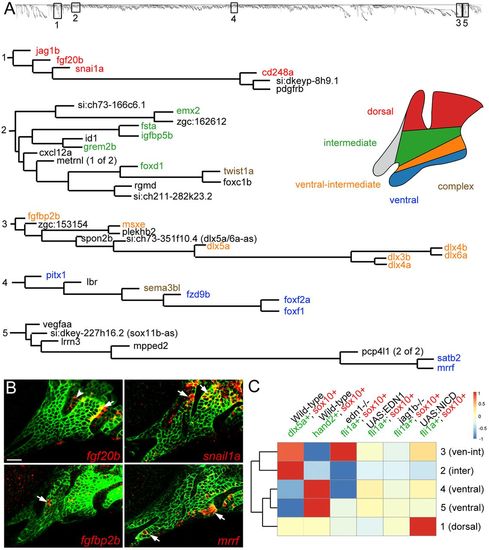
Co-variance network analysis reveals cohorts of similarly regulated arch genes. (A) Five representative clusters (1-5) were chosen from the dendrogram (top) generated by co-variance analysis. Gene names are color-coded based on expression patterns that are published or verified in this study. ‘Complex’ refers to genes with broader expression in multiple domains. (B) Four genes discovered by co-variance analysis were confirmed by in situ hybridization (red) of sox10:GFPCAAX embryos at 36 hpf; anti-GFP staining (green) marks CNCCs of the mandibular and hyoid arches. Arrows indicate CNCC expression and the arrowhead indicates fgf20b expression in the first pharyngeal pouch. Scale bar: 20 μm. (C) TOM driver array analysis (see Materials and Methods) shows experiments that drove clustering (red) or disrupted clustering (blue). The dendrogram on the left shows the relatedness of clusters based on which datasets drove their clustering. EXPRESSION / LABELING:
|
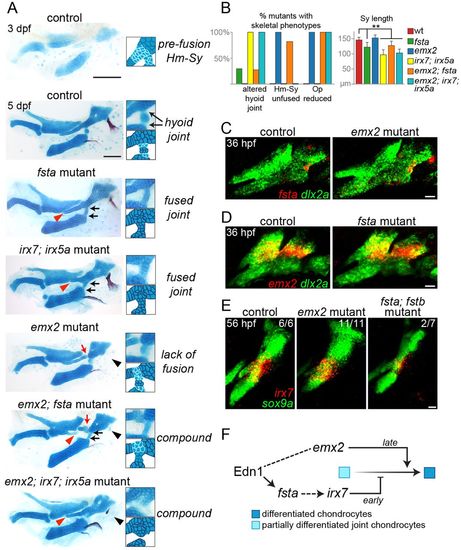
Distinct roles of Fsta and Emx2 in hyoid skeletal development. (A) Dissected mandibular and hyoid skeletons stained with Alcian Blue (cartilage) and Alizarin Red (bone). At 3 dpf, cells between the hyomandibular (Hm) and symplectic (Sy) cartilages and at the forming hyoid joint region stain weakly with Alcian Blue, reflecting their chondrogenic immaturity. By 5 dpf, rearrangements among cells at the Hm-Sy junction result in elongation of Sy, and maturation of cells at the junction fuses Hm and Sy. Cells in the hyoid joint remain immature and weakly Alcian Blue positive. In fsta mutants, the Sy is shortened (red arrowhead), with a build up of chondrocytes in the Hm-Sy junction, and hyoid joint cells inappropriately mature into chondrocytes strongly stained by Alcian Blue, fusing the joint (black arrows). These phenotypes are similar to those of irx7; irx5a mutants. In emx2 mutants, the Hm and Sy cartilages fail to fuse completely (red arrow), and the opercle bone is lost (black arrowhead). emx2; fsta mutants show a compound phenotype, including hyoid joint fusion and reduction of Sy. Hm and Sy are disconnected in emx2; fsta but not emx2; irx7; irx5a mutants. Scale bars: 100 μm. (B) Penetrance of skeletal phenotypes in each genotype: n (sides)=57 (fsta−/−), 42 (emx2−/−), 5 (irx7−/−; irx5a−/−), 11 (emx2−/−; fsta−/−) and 7 (emx2−/−; irx7−/−; irx5a−/−). **P<0.01 versus wild type. (C,D) Two-color in situ hybridization at 36 hpf shows that fsta expression (red) is normal in emx2 mutants, and emx2 expression (red) is normal in fsta mutants. (E) Hyoid joint expression of irx7 at 56 hpf is unaffected in emx2 mutants and reduced in 2/7 fsta; fstb mutants. In green, dlx2a labels arch CNCCs and sox9a labels chondrocytes. Scale bars: 20 μm in C-E. (F) Model for Emx2 and Fsta function in the hyoid arch. At early stages, Fsta promotes irx7 expression, preventing differentiation and cartilage matrix accumulation between Hm and Sy and allowing chondroprogenitors to rearrange into the single stack of Sy chondrocytes. Following rearrangements, Emx2 promotes chondrogenic differentiation to fuse Hm and Sy into a seamless cartilage. By contrast, there is a continuous requirement for Fsta function at the nearby hyoid joint to maintain its patency through active inhibition of chondrogenesis. |
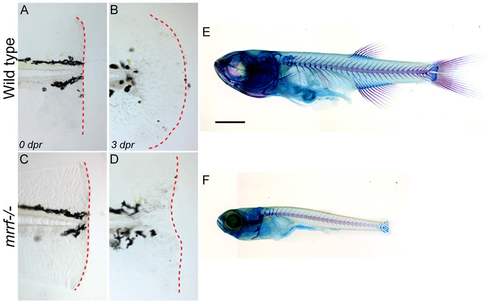
Growth delay and defective fin regeneration in mrrf mutants. (A-D) Wild-type and mrrf-/- embryos had their tail fins amputated at 3 dpf. The dotted red lines show the caudal extent of the tail fin and the lack of regeneration in mutants 3 days post-resection (dpr). (E and F) Alcian blue and Alizarin red staining of cartilage and bone, respectively, show a severe growth defect in mrrf mutants at one month of age. Scale bar = 100 μm. PHENOTYPE:
|
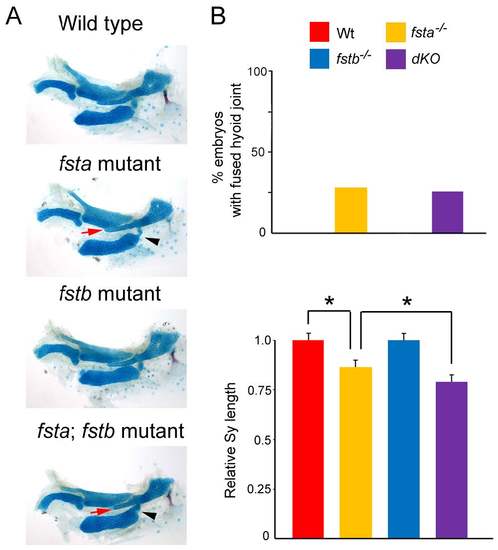
Redundancy of fsta and fstb in hyoid skeletal development. (A) Alcian blue and Alizarin red staining of control, fsta, fstb, and fsta; fstb double mutant embryos at 5 dpf. In fsta but not fstb single mutants, the Sy is shortened (red arrow), and the hyoid joint is fused (black arrowhead). fsta; fstb double mutants display a slight enhancement of craniofacial defects compared to fsta mutants. (B) Quantification of fused hyoid joints and Sy length (number of sides examined for fsta, fstb, and fsta; fstb mutants = 14, 10 and 23, respectively). *p < 0.05 in student’s t-test. |
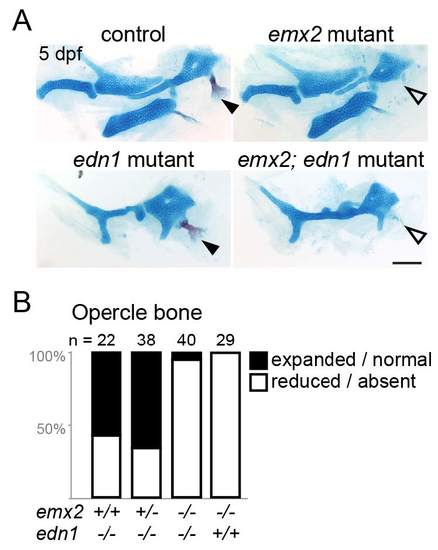
Analysis of emx2; edn1 compound mutants. (A) Alcian blue and Alizarin red staining of control, emx2, edn1, and emx2; edn1 double mutant embryos at 5 dpf. In edn1 mutants, the opercle bone is variably expanded / normal (closed arrowhead) or reduced / absent (open arrowhead). In emx2 and emx2; edn1 mutants, the opercle is almost always reduced or absent. In addition, loss of emx2 fails to rescue the reduced ventral cartilage in edn1 mutants. Scale bar = 100 μm. (B) Quantification of the percentage of opercle bone defects in single and double mutants. The number of sides examined is listed above each bar. The decrease in the proportion of larvae with expanded / normal opercle bone in emx2-/-; edn1-/- mutants compared with emx2+/+; edn1-/- was significant at p < 0.0001 (two-tailed Chi-square). PHENOTYPE:
|

Unillustrated author statements PHENOTYPE:
|