
Fig. 1
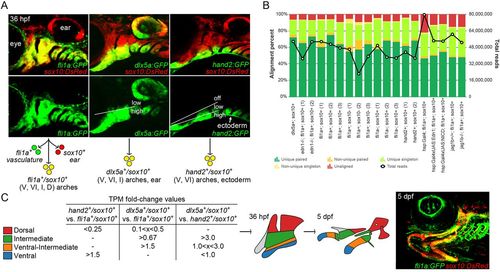
Isolation of arch CNCCs for RNAseq. (A) Cells were sorted using transgenic lines that label different populations of arch CNCCs. fli1a:GFP and sox10:DsRed overlap throughout arch CNCCs (yellow); dlx5a:GFP and sox10:DsRed in CNCCs of ventral (V) to intermediate (I) domains, as well as some dorsal (D) domain CNCCs and the otic vesicle; and hand2:GFP and sox10:DsRed in ventral and more weakly in ventral-intermediate (VI) CNCCs [modified from Barske et al. (2016) and Medeiros and Crump (2012)]. (B) Breakdown of alignment results for each RNAseq experiment, showing the percentage of reads aligned to a unique site in the genome and whether both paired-end reads were aligned. The line graph shows the total number of reads acquired for each sample. (C) Dorsal, intermediate, ventral-intermediate, and ventral domains were defined by their relative enrichment levels (i.e. fold-change of TPM values) among hand2:GFP; sox10:DsRed, dlx5a:GFP; sox10:DsRed, and fli1a:GFP; sox10:DsRed cells. These domains correspond to specific parts of the arches at 36 hpf that give rise to the larval craniofacial skeleton at 5 dpf (shown for context in a fli1a:GFP; sox10:DsRed fish). |
| Genes: | |
|---|---|
| Fish: | |
| Anatomical Terms: | |
| Stage Range: | Prim-25 to Day 5 |