
- Title
-
The Roles of RNA Polymerase I and III Subunits Polr1c and Polr1d in Craniofacial Development and in Zebrafish Models of Treacher Collins Syndrome
- Authors
- Noack Watt, K.E., Achilleos, A., Neben, C.L., Merrill, A.E., Trainor, P.A.
- Source
- Full text @ PLoS Genet.
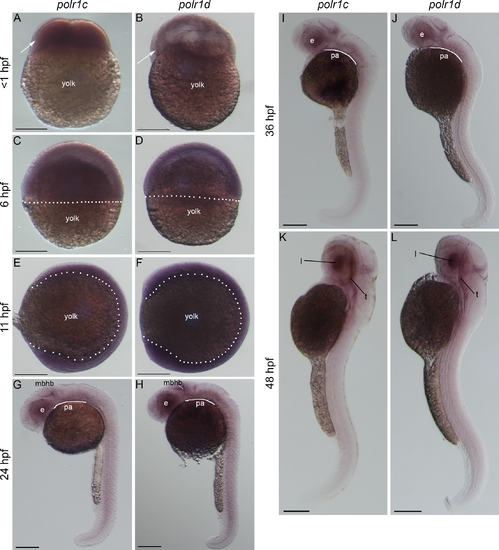
polr1c and polr1d are dynamically expressed during zebrafish embryogenesis. polr1c and polr1d are maternally expressed at early stages (A,B, arrows) and ubiquitously expressed at 6 hpf (C,D) and 11 hpf (E,F) when the embryo surrounds the yolk (dashed lines). At 24 hpf, expression becomes enriched in regions such as the eye and midbrain-hindbrain boundary (G,H). Elevated levels of expression are evident in the pharyngeal arches (adjacent to curved line) at 36 hpf (I,J) whereas lower levels are observed throughout the embryo at 48 hpf and beyond (K,L) and beyond. Abbreviations: e, eye; mbhb, midbrain-hindbrain boundary; pa, pharyngeal arches; l, lens; t, tectum. Scale bar = 200 μm. |
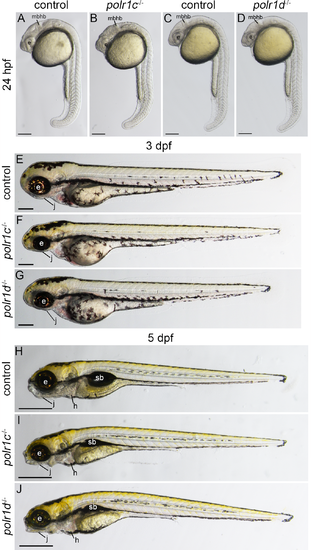
Mutations in polr1c and polr1d disrupt craniofacial development in zebrafish embryos. 24 hpf (A-D), 3 dpf (E-G) and 5 dpf (H-J) polr1c-/- and polr1d-/- zebrafish exhibit craniofacial defects, including smaller eyes, a disrupted midbrain-hindbrain boundary and cranial necrosis compared to controls. At 3 dpf, distinct craniofacial anomalies such as a smaller jaw and eyes become apparent. By 5 dpf, polr1c-/- and polr1d-/- mutants are distinguished from their control siblings by their smaller head, microphthalmia, jaw hypoplasia, and failure to inflate their swim bladder (E-G). Abbreviations: e, eye; mbhb, midbrain hindbrain boundary; j, jaw; h, heart; sb, swim bladder. Scale bar = 200 μm (A-G) and 500 μm (H-J). |

Craniofacial cartilage development is disrupted in polr1c-/- and polr1d-/- mutant embryos. (A-C) Alcian blue staining reveals cranial cartilage in 5 dpf polr1c-/- and polr1d-/- mutant embryos is hypoplastic compared to controls. (D-F) The jaws of mutant embryos are smaller overall, with noticeable differences in the size of Meckel’s cartilage, the palatoquadrate, and ceratohyal elements. (G-I) Staining of the viscerocranium reveals smaller cartilage elements derived from each of the pharyngeal arches in mutant embryos, most notably the ceratobranchials, as well as altered polarity of the ceratohyal. (J-L) Staining of the neurocranium reveals hypoplasia of the ethmoid plate. Abbreviations: M, Meckel’s cartilage; pq, palatoquadrate; ch, ceratohyal; cb, ceratobranchial; ep, ethmoid plate; pch, parachordal. Scale bar = 200 μm. |

Analysis of NCC development in polr1c and polr1d mutant embryos. (A-H) sox10 expression at 12 hpf and (I-P) foxd3 expression at 14 hpf reveal relatively normal patterns of early cranial NCC specification and migration in polr1c-/- and polr1d-/- embryos (black arrows). (Q-X) In contrast, dlx2 expression at 36 hpf reveals slightly diminished domains of activity in mutant embryos, particularly with respect to the posterior pharyngeal arches, which is suggestive of fewer mature NCC colonizing the pharyngeal arches. White arrows indicate pharyngeal arches 1 and 2. Scale bar = 200 μm. EXPRESSION / LABELING:
PHENOTYPE:
|
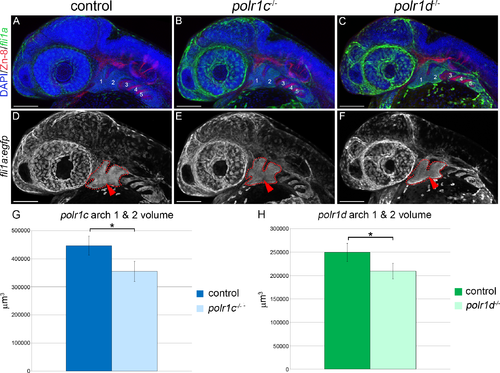
Pharyngeal arch size is reduced in polr1c-/- and polr1d-/- mutants. (A-C) Immunostaining of 36hpf fli1a:egfp labeled control, polr1c-/- and polr1d-/- mutant embryos with Zn-8 (red), which labels the endodermal pouches, revealed comparatively normal pharyngeal arch and pharyngeal pouch patterning. Pharyngeal arches 1–5 are indicated. (D-F) fli1a:egfp labeling of post-migratory NCC illustrates an overall reduction in pharyngeal arch size in polr1c-/- and polr1d-/- mutants. Pharyngeal arches 1 and 2 are outlined in red. (G-H) Quantification of pharyngeal arches 1 & 2 (red arrows, D-F) volume revealed a reduction in polr1c-/- (G) and polr1d-/- (H) mutants. Scale bar = 100 μm. * = p < 0.05 and error bars represent 95% confidence intervals. PHENOTYPE:
|
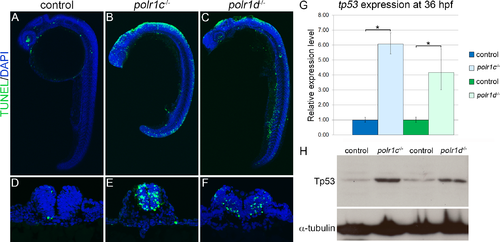
Increased Tp53-dependent cell death within the neuroepithelium of polr1c-/- and polr1d-/- embryos. (A-C) TUNEL staining (green fluorescence) revealed increased cell death in the cranial region and dorsal tissues of 24 hpf polr1c-/- and polr1d-/- mutant embryos. (D-F) Transverse sections revealed that cell death (green fluorescence) occurred primarily within the neuroepithelium. (G) qPCR (H) and Western blot analyses demonstrated the levels of tp53 and Tp53 were increased respectively in 36 hpf and 5 dpf polr1c-/- and polr1d-/- mutant embryos compared to controls. α-tubulin was used as a loading control. * = p < 0.05 and error bars represent 95% confidence intervals. |

ZFIN is incorporating published figure images and captions as part of an ongoing project. Figures from some publications have not yet been curated, or are not available for display because of copyright restrictions. PHENOTYPE:
|

tp53 inhibition ameliorates cartilage anomalies in polr1d-/- mutant embryos in a dosage-dependent manner. (A-D) Alcian blue staining of cartilage in an allelic series of polr1d and tp53 mutant embryos. Dosage-dependent improvement in cartilage development is particularly noticeable in the jaw (E-H), elements of the viscerocranium (I-L), and more specifically the ceratohyal (G-L). Abbreviations: M, Meckel’s cartilage; pq, palatoquadrate; ch, ceratohyal; cb, ceratobranchial. Scale bar = 200 μm. |
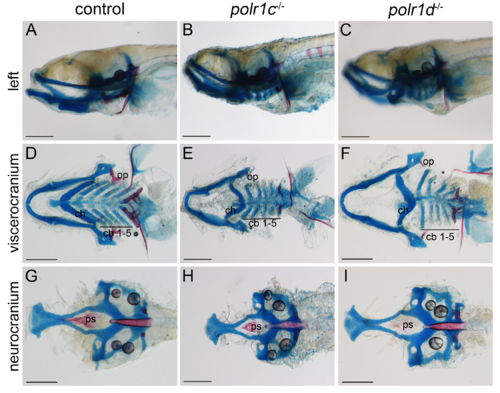
polr1c and polr1d mutant embryos have craniofacial cartilage anomalies at 9 dpf. (A-C) Alcian blue and Alizarin red staining reveals diminished cartilage and bone formation in polr1c and polr1d mutant embryos. (D-F) Dissection of the viscerocranium revealed mispatterning of the ceratohyal (ch), and hypoplasia of the ceratobranchial cartilages (cb) in polr1c and polr1d mutants. There is also hypoplasia of bone elements including the opercles (op) and pharyngeal teeth. (G-H) Dissection of the neurocranium reveals reduced ossification of the parasphenoid (ps) in mutant embryos. Scale bar = 200 μm. |
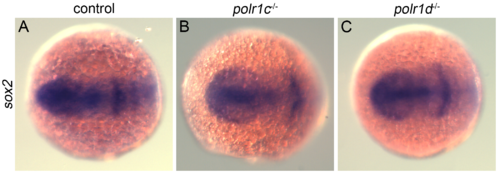
Neural plate formation in 11 hpf embryos. (A-C) polr1c-/- and polr1d-/- mutant embryos show similar expression of sox2 compared to controls as revealed by in situ hybridization. This indicates that neural plate formation, a precursor to formation of neural crest cells, occurs in mutant embryos. PHENOTYPE:
|
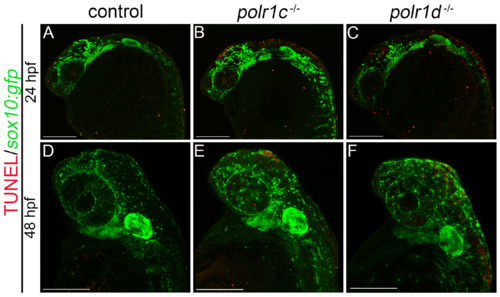
The migratory NCC population is not undergoing apoptosis in polr1c and polr1d mutant embryos. (A-D) TUNEL staining in sox10:gfp embryos shows increased cell death in mutant embryos which does not co-localize with the migratory NCC population. At 24 hpf, increased cell death can be seen in the neuroepithelial region of polr1c-/- and polr1d-/- embryos. (E-F) At 48 hpf, increased cell death can be observed in regions of the brain and eye of mutant embryos, but not within the pharyngeal arches. Scale bar = 200 μm. PHENOTYPE:
|
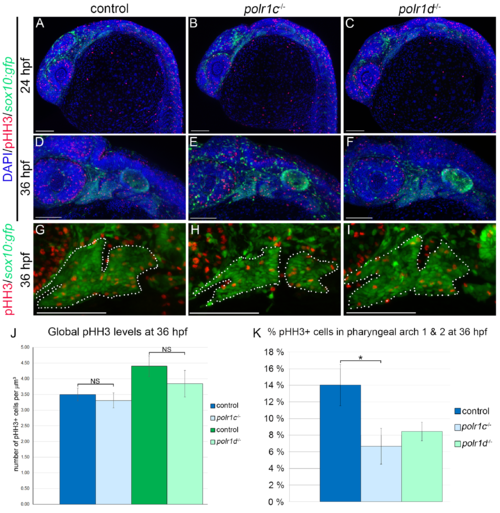
Proliferation within pharyngeal arches 1 & 2 is reduced. (A-C) similar levels of pHH3 staining are present in control, polr1c-/- and polr1d-/- embryos at 24 hpf. (D-F) Proliferation at 36 hpf also occurs globally at broadly similar levels in controls and mutant embryos, but there differences in the number of pHH3+ cells within pharyngeal arches 1 and 2. (G-I) Magnified views of pharyngeal arches 1 and 2 (outlined). (J, K) Quantification of pHH3+ labeled cells illustrating no global overall decrease in mutants embryos compared to controls, but a significant decrease in the percentage of pHH3+ cells in pharyngeal arches 1 and 2 in polr1c mutant embryos. polr1d mutant embryos showed a similar level of proliferation as polr1c mutants. Scale bar = 100 μm. * = p < 0.01 and error bars represent 95% confidence intervals. PHENOTYPE:
|
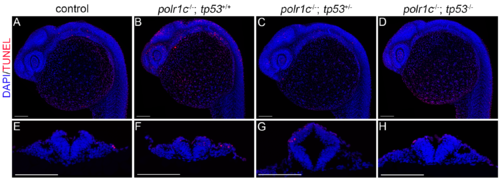
tp53 inhibition reduces cell death in 24 hpf polr1c mutant embryos. (A-D) TUNEL staining in polr1c; tp53 embryos reveals a decrease in cell death depending on the dosage of tp53. (E-F) Cross sections confirm diminished levels of cell death within and around the neural tube. Scale bars = 100 μm. PHENOTYPE:
|
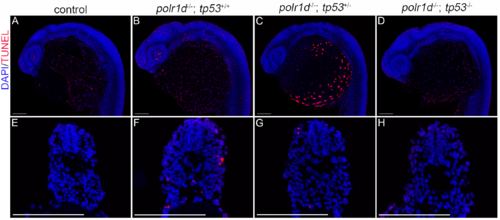
tp53 inhibition reduces cell death in 24 hpf polr1d mutant embryos. (A-D) TUNEL staining in polr1d; tp53 embryos reveals a decrease in cell death depending on the dosage of tp53. (E-F) Cross sections confirm diminished levels of cell death around the neural tube. Scale bars = 100 μm. PHENOTYPE:
|
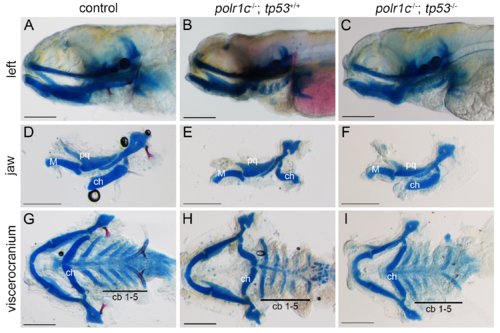
tp53 inhibition improves the phenotype of polr1c mutant embryos. (A-I) Alcian blue and alizarin red staining reveal improved cartilage formation and patterning in polr1c-/-; tp53-/- embryos compared to polr1c-/-; tp53+/+ embryos. Abbreviations: M, Meckel’s cartilage; pq, palatoquadrate; ch, ceratohyal; cb, ceratobranchial. Scale bars = 200 μm |
|
ZFIN is incorporating published figure images and captions as part of an ongoing project. Figures from some publications have not yet been curated, or are not available for display because of copyright restrictions. PHENOTYPE:
|