
- Title
-
Optogenetic Control of Nodal Signaling Reveals a Temporal Pattern of Nodal Signaling Regulating Cell Fate Specification during Gastrulation
- Authors
- Sako, K., Pradhan, S.J., Barone, V., Inglés-Prieto, Á., Müller, P., Ruprecht, V., Čapek, D., Galande, S., Janovjak, H., Heisenberg, C.P.
- Source
- Full text @ Cell Rep.
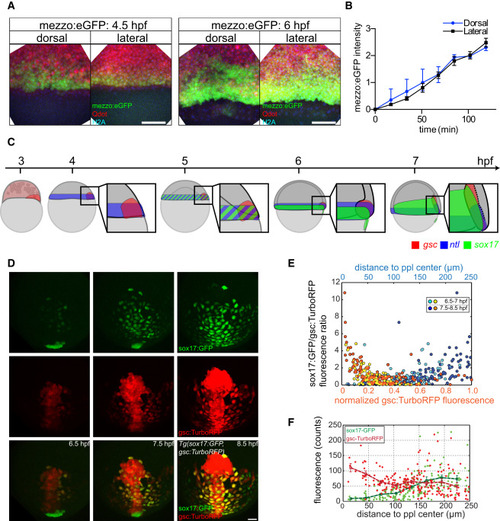
Temporal Nodal Signaling Activity and Cell Fate Specification (A) Projection of image stacks showing mezzo:eGFP expression in the germ ring of Tg(mezzo:eGFP) embryos at 4.5 and 6 hpf injected with Qdots and expressing H2A-tagBFP to mark nuclei; dorsal and lateral views. Scale bar, 100 µm. (B) Relative intensity of mezzo:eGFP in Tg(mezzo:eGFP) embryos at dorsal (blue line) and lateral side (black line) of the germ ring from 4.5-6.5 hpf; n = 3 embryos each. (C) Schematic illustration of cell fate specification in zebrafish embryos at blastula and gastrula stages (3-7 hpf). gsc, ntl, and sox17 expression domains are shown in red, blue, and green, respectively; dorsal germ ring margin (shield) at 4-6 hpf is magnified in the boxed areas next to the illustrations of whole embryos; dorsal side is to the right. (D) Projection of image stacks showing sox17:GFP and gsc:TurboRFP expression in Tg(sox17:GFP;gsc:TurboRFP) embryos at 6.5, 7.5, and 8.5 hpf. Scale bar, 50 µm. (E) Ratio of single cell sox17:GFP/gsc:TurboRFP fluorescence intensity values as a function of either normalized TurboRFP fluorescence intensities (yellow and orange dots), or distance to the prechordal plate (ppl) center measured within a distance of 250 µm around the ppl center (light and dark blue dots) in Tg(sox17:GFP; gsc:TurboRFP) embryos between 6.5-8.5 hpf; data were pooled for different time spans of development with yellow and light blue = 6.5-7 hpf and orange and dark blue = 7.5-8.5 hpf; single cell gsc:TurboRFP fluorescence values on the x axis were normalized to the maximum average single cell fluorescence intensity at each selected time point; n = 4 embryos and n = 208 cells. (F) Single cell sox17:GFP (green) and gsc:TurboRFP (red) fluorescence intensity values as a function of distance to the ppl center used for calculating the fluorescence ratio in (E); binned data are shown as green and red lines; error bar, mean ± SEM. See also Movies S1, S2, and S3. |
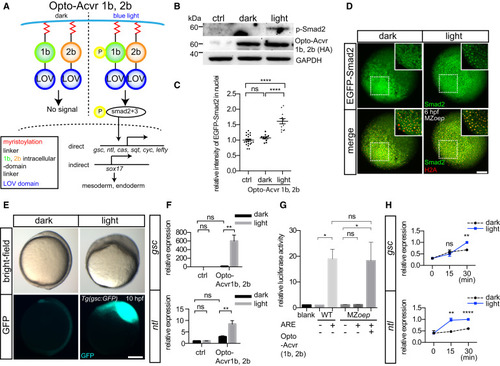
Construction and Validation of Photoactivatable Nodal Receptors (A) Schematic illustration of the photoactivatable Nodal receptor constructs and their function; LOV domain is shown in blue, and intracellular domains of acvr1b and acvr2b are shown in green and orange, respectively; both receptors are anchored to the plasma membrane by a myristoylation motif shown in red; under blue light stimulation, the 1b and 2b receptors are dimerized, leading to the phosphorylation of smad2 and smad3 and activation of target gene expression. (B) Western blot showing the expression of phosphorylated smad2, Opto-acvr1b, Opto-acvr2b, and GAPDH at dome stage (5 hpf) in MZoep injected with opto-acvr1b and opto-acvr2b mRNA (20 pg each); water-injected embryos were used as controls (ctrl); embryos were exposed to light from high to dome stage (3-5 hpf). (C) Quantification of nuclear EGFP-smad2 signal in shield stage (6 hpf) MZoep embryos injected with EGFP-smad2 (20 pg), H2A-mCherry (20 pg), and opto-acvr1b and opto-acvr2b mRNA (20 pg each) shown in (D); mean ± SEM; n (ctrl) = 22, n (dark) = 10, n (light) = 12 embryos; ANOVA test was used for the statistical evaluation with ****p < 0.0001; ns, not significant; MZoep embryos injected with EGFP-smad2 and H2A-mCherry mRNA only were used as ctrl. (D) Projection of image stacks showing the localization of EGFP-smad2 in shield stage (6 hpf) MZoep embryos injected with EGFP-smad2 (20 pg), H2A-mCherry (20 pg), and opto-acvr1b and opto-acvr2b mRNA (20 pg each); animal pole views; embryos were exposed to blue LED light from high to shield stage (3-6 hpf); insets at the top right of each panel show single image planes of the boxed region in the main panel; EGFP-smad2 and H2A-mCherry are shown in green and red, respectively. Scale bar, 100 µm. (E) Tg(gsc:GFP) embryos at bud stage (10 hpf) injected with opto-acvr1b and opto-acvr2b mRNA (20 pg each); embryos were exposed to blue LED light from two-cell to bud stage (0.5-10 hpf); upper panels are bright-field images and lower panels show gsc:GFP expression. Scale bar, 200 µm. (F) Relative expression levels of gsc and ntl mRNA at shield stage (6 hpf) in MZoep mutant embryos injected with opto-acvr1b and opto-acvr2b mRNA (20 pg each); embryos were exposed to light from two cell to shield stage (0.5-6 hpf); values are fold-induction compared to water-injected MZoep mutant embryos kept in dark; mean ± SEM; independent triplicate experiments; ANOVA test was used for the statistical evaluation with **p < 0.01; ns, not significant. (G) Quantification of luciferase activity induced by activin response element (ARE)-driven luciferase expression in wild-type (WT) and MZoep mutant embryos injected with 3× ARE-lux plasmid (12.5 pg) and opto-acvr1b and opto-acvr2b mRNA (20 pg each); embryos were exposed to light from high to shield stage (3–6 hpf); values are fold-induction compared to water-injected WT ctrl embryos; mean ± SEM; independent triplicate experiments; ANOVA test was used for the statistical evaluation with p < 0.05; ns, not significant. (H) Relative expression levels of gsc and ntl mRNA at 5, 5.25 and 5.5 hpf in MZoep embryos injected with opto-acvr1b and opto-acvr2b mRNA (20 pg each). Embryos were first exposed to light from sphere to dome stage (4-5 hpf) and then kept either in the dark or light for another 15 or 30 min; p values were determined between embryos kept in the dark and light at 15 and 30 min with t test; values are fold-induction over embryos at 5.5 hpf kept in the light; mean ± SEM; independent triplicate experiments; **p < 0.01; ns, not significant. See also Figures S1, S2, and S3. |
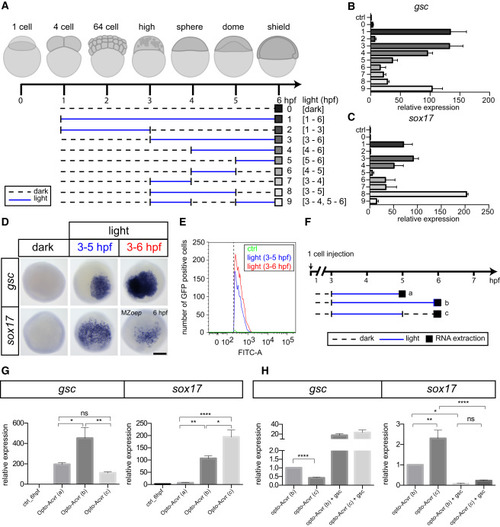
Temporally Patterned Nodal Signaling Activation and Cell Fate Specification (A) Schematic illustration of temporally patterned blue LED light stimulation of Opto-acvr1b and 2b signaling; blue continuous lines indicate light stimulation (light), and black dashed lines indicate no stimulation (dark); mRNA expression analysis was done at 6 hpf (boxes). (B and C) Relative expression levels of gsc (B) and sox17 (C) mRNA in shield stage (6 hpf) MZoep embryos injected with opto-acvr1b and opto-acvr2b mRNA (20 pg each) and exposed to blue LED light using the temporal patterns shown in (A); gene expression levels were quantified by qPCR; water-injected embryos were used as controls (ctrl); sample numbers correspond to the numbers of the different stimulation patterns shown in (A); values are fold-induction compared to ctrl embryos; mean ± SEM; independent triplicate experiments. (D) Expression of gsc and sox17 mRNA detected by whole-mount in situ hybridization in shield stage (6 hpf) MZoep embryos injected with opto-acvr1b and opto-acvr2b mRNA (20 pg each); embryos were kept in the dark or activated with blue LED light from either high to dome stage (3-5 hpf) or high to shield stage (3-6 hpf); animal pole views. Scale bar, 200 µm. (E) FACS analysis of MZoep;Tg(gsc:GFP) embryos at shield stage (6 hpf) injected with opto-acvr1b and opto-acvr2b mRNA (20 pg each) and activated with blue LED light from either high to dome stage (3-5 hpf) or high to shield stage (3-6 hpf); non-injected embryos were used as ctrl; intensity of gsc:GFP and number of gsc:GFP positive cells were plotted on the x and y axes, respectively. (F) Schematic illustration of temporally patterned blue LED light stimulation of Opto-acvr1b and Opto-acvr2b signaling; blue continuous lines indicate light stimulation (light), and black dashed lines indicate no stimulation (dark); black box marks time point of mRNA expression analysis. (G) MZoep embryos injected with opto-acvr1b and opto-acvr2b mRNA (20 pg each) were stimulated using the temporal patterns shown in (F); expression levels of gsc and sox17 were determined by qPCR; water-injected embryos were used as ctrl; sample letters a-c correspond to the letters of the different stimulation patterns shown in (F); mean ± SEM; independent triplicate experiments, ANOVA test was used for the statistical evaluation with p < 0.05, **p < 0.01, ****p < 0.0001; ns, not significant. (H) MZoep embryos injected with opto-acvr1b, opto-acvr2b mRNA (20 pg each), and gsc mRNA (20 pg) were stimulated using the temporal pattern b or c shown in (F); expression levels of gsc and sox17 were determined by qPCR at shield stage (6 hpf); values are fold-induction compared to opto-acvr1b and opto-acvr2b mRNA injected embryos stimulated using the temporal pattern b (3-6 hpf); mean ± SEM; independent quadruplicate experiments; for statistical evaluation t test was used for gsc expression (between temporal activation patterns b and c), and ANOVA test was used for sox17 expression with *p < 0.05, **p < 0.01, ****p < 0.0001; ns, not significant. See also Figure S4 and Table S1. |
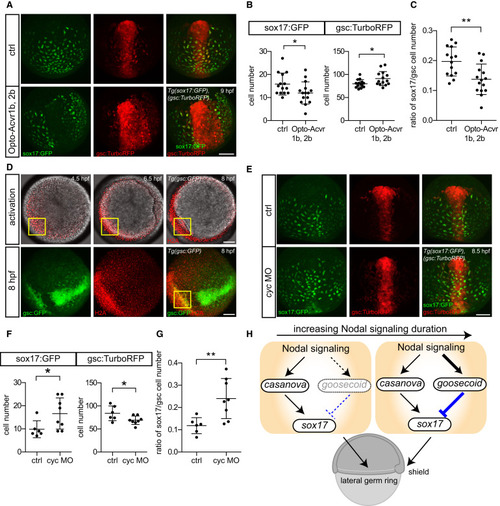
Endogenous Nodal Signaling Duration and Cell Fate Specification (A) sox17:GFP and gsc:TurboRFP expression in opto-acvr1b and opto-acvr2b mRNA (20 pg each) injected Tg(sox17:GFP;gsc:TurboRFP) embryos at 90% epiboly stage (9 hpf); embryos were activated with blue LED from 5-6.5 hpf; dorsal views; water-injected embryos were used as controls (ctrl). Scale bar, 100 µm. (B) Number of sox17:GFP and gsc:TurboRFP positive cells within the prechordal plate (ppl) region (200 µm2 around the ppl center) for embryos shown in (A) at 9 hpf; n (ctrl) = 14, n (Opto-acvr1b, Opto-acvr2b) = 15 embryos; mean ± SD; t test was used for the statistical evaluation with p* < 0.05. (C) Ratio of sox17:GFP to gsc:TurboRFP expressing cells within the ppl region for embryos shown in (B) at 9 hpf; n (ctrl) = 14, n (Opto-acvr1b, Opto-acvr2b) = 15 embryos& mean ± SD; t test was used for the statistical evaluation with **p < 0.01. (D) Activation of ectopic gsc:GFP expression in opto-acvr1b and opto-acvr2b mRNA (20 pg each) and H2A-mCherry (20 pg) injected Tg(gsc:GFP) embryos at 4.5, 6.5, and 8 hpf; gsc:GFP in green and H2A-mCherry outlining nuclei in red; Nodal signaling was activated in a spatially restricted area (yellow box; 150 µm2) within the ventral germ ring margin using a 458 nm laser from 4.5-8 hpf (top panels); dashed white lines indicate endogenous (top middle) and induced (top right) leading edge ppl cells; bottom panel shows image stack projections of gsc:GFP and mCherry (nuclei) expression in activated embryos at 8 hpf; animal pole view. Scale bar, 100 µm. (E) sox17:GFP and gsc:TurboRFP expression in cyc morphant (cyc MO) (0.5 ng/embryo) Tg(sox17:GFP;gsc:TurboRFP) at 80% epiboly stage (8.5 hpf); water-injected embryos were used as ctrl; dorsal views. (F) Number of sox17:GFP and gsc:TurboRFP positive cells within the ppl region (200 µm2 around the ppl center) for embryos shown in (E) at 8.5 hpf; n (ctrl) = 6, n (cyc MO) = 8 embryos; mean ± SD; t test was used for the statistical evaluation with *p < 0.05. (G) Ratio of sox17:GFP to gsc:TurboRFP expressing cells within the ppl region for embryos shown in (F) at 8.5 hpf; n (ctrl) = 6, n (cyc MO) = 8 embryos; mean ± SD; t test was used for the statistical evaluation with **p < 0.01. (H) Schematic illustration of changes in the induction of genes involved in mesendoderm cell fate specification as a function of endogenous Nodal signaling duration. See also Movie S4. |
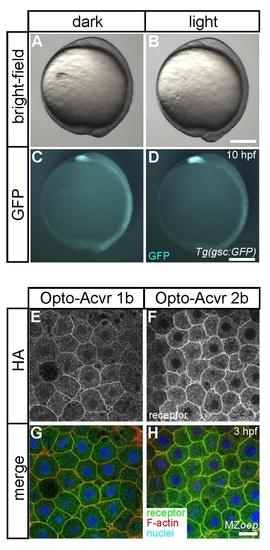
Embryo light exposure and subcellular localization of Opto-acvr 1b and 2b. (A-D) Tg(gsc:GFP) embryos at bud stage (10 hpf) either kept in the dark (A, C) or exposed to blue LED light (B, D; 5.12 µW/mm2, see material and methods) from 2-cell to bud stage (0.510 hpf); upper (A, B) and lower (C, D) panels show bright-field and fluorescent images, respectively; scale bar, 200 µm. (EH) Anti- HA (Opto-acvr 1b- or 2bHA), phalloidin (filamentous actin), and DAPI (nuclei) staining of cells at the animal pole of optoacvr 1b or 2b mRNA (20 pg each)- injected MZoep embryos at high stage (3 hpf); scale bar, 20 µm. |
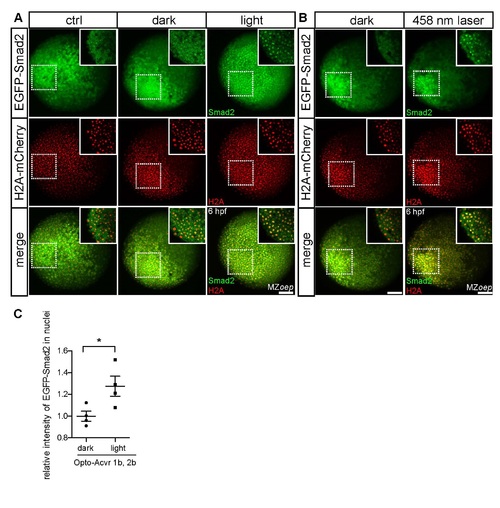
Nuclear localization of EGFP-smad2 by opto-acvr 1b and 2b activation. (A) Projection of image stacks showing the localization of EGFP-smad2 in shield stage (6 hpf) MZoep embryos injected with EGFP-smad2 (20pg), H2A-mCherry (20 pg) and opto-acvr 1b and 2b (20 pg each) mRNAs; animal pole views; control (ctrl) embryos were injected with EGFP-smad2 and H2A-mCherry only; embryos were exposed to light from high to shield stage (36 hpf); insets at the top-right of each panel show single image planes of the boxed region in the main panel; EGFPsmad2 and H2AmCherry are shown in green and red, respectively; scale bar, 100 µm. (B) Projection of image stacks showing the localization of EGFP- smad2 in shield stage (6 hpf) MZoep embryos injected with EGFP-smad2 (20pg), H2A-mCherry (20 pg) and opto-acvr 1b and 2b (20 pg each) mRNA; embryos were stimulated with a 458 nm laser from high to shield stage (36 hpf); EGFP- smad2 and H2AmCherry are shown in green and red, respectively; insets in at the top-right of each panel show single image planes of the boxed region in the main panel; scale bar, 100 µm. (C) Quantification of nuclear EGFP-smad2 signal in (B); mean ± SEM; n (dark) = 4, n (light) = 4 embryos, t-test was used for the statistical evaluation with p* < 0.05. |
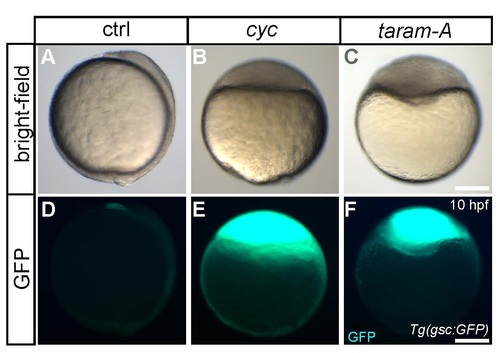
Activation of Nodal signaling by Cyc and TARAM-A overexpression (A-F) Tg(gsc:GFP) embryos at bud stage (10 hpf) injected with either cyc (B, E; 100pg) or taram-A (C, F; 5 pg) mRNA; waterinjected embryos were used as controls (A, D; ctrl); upper (AC) and lower (D-F) panels show bright-field and fluorescent images, respectively; scale bar, 200 µm. |