
|
Fig. S2
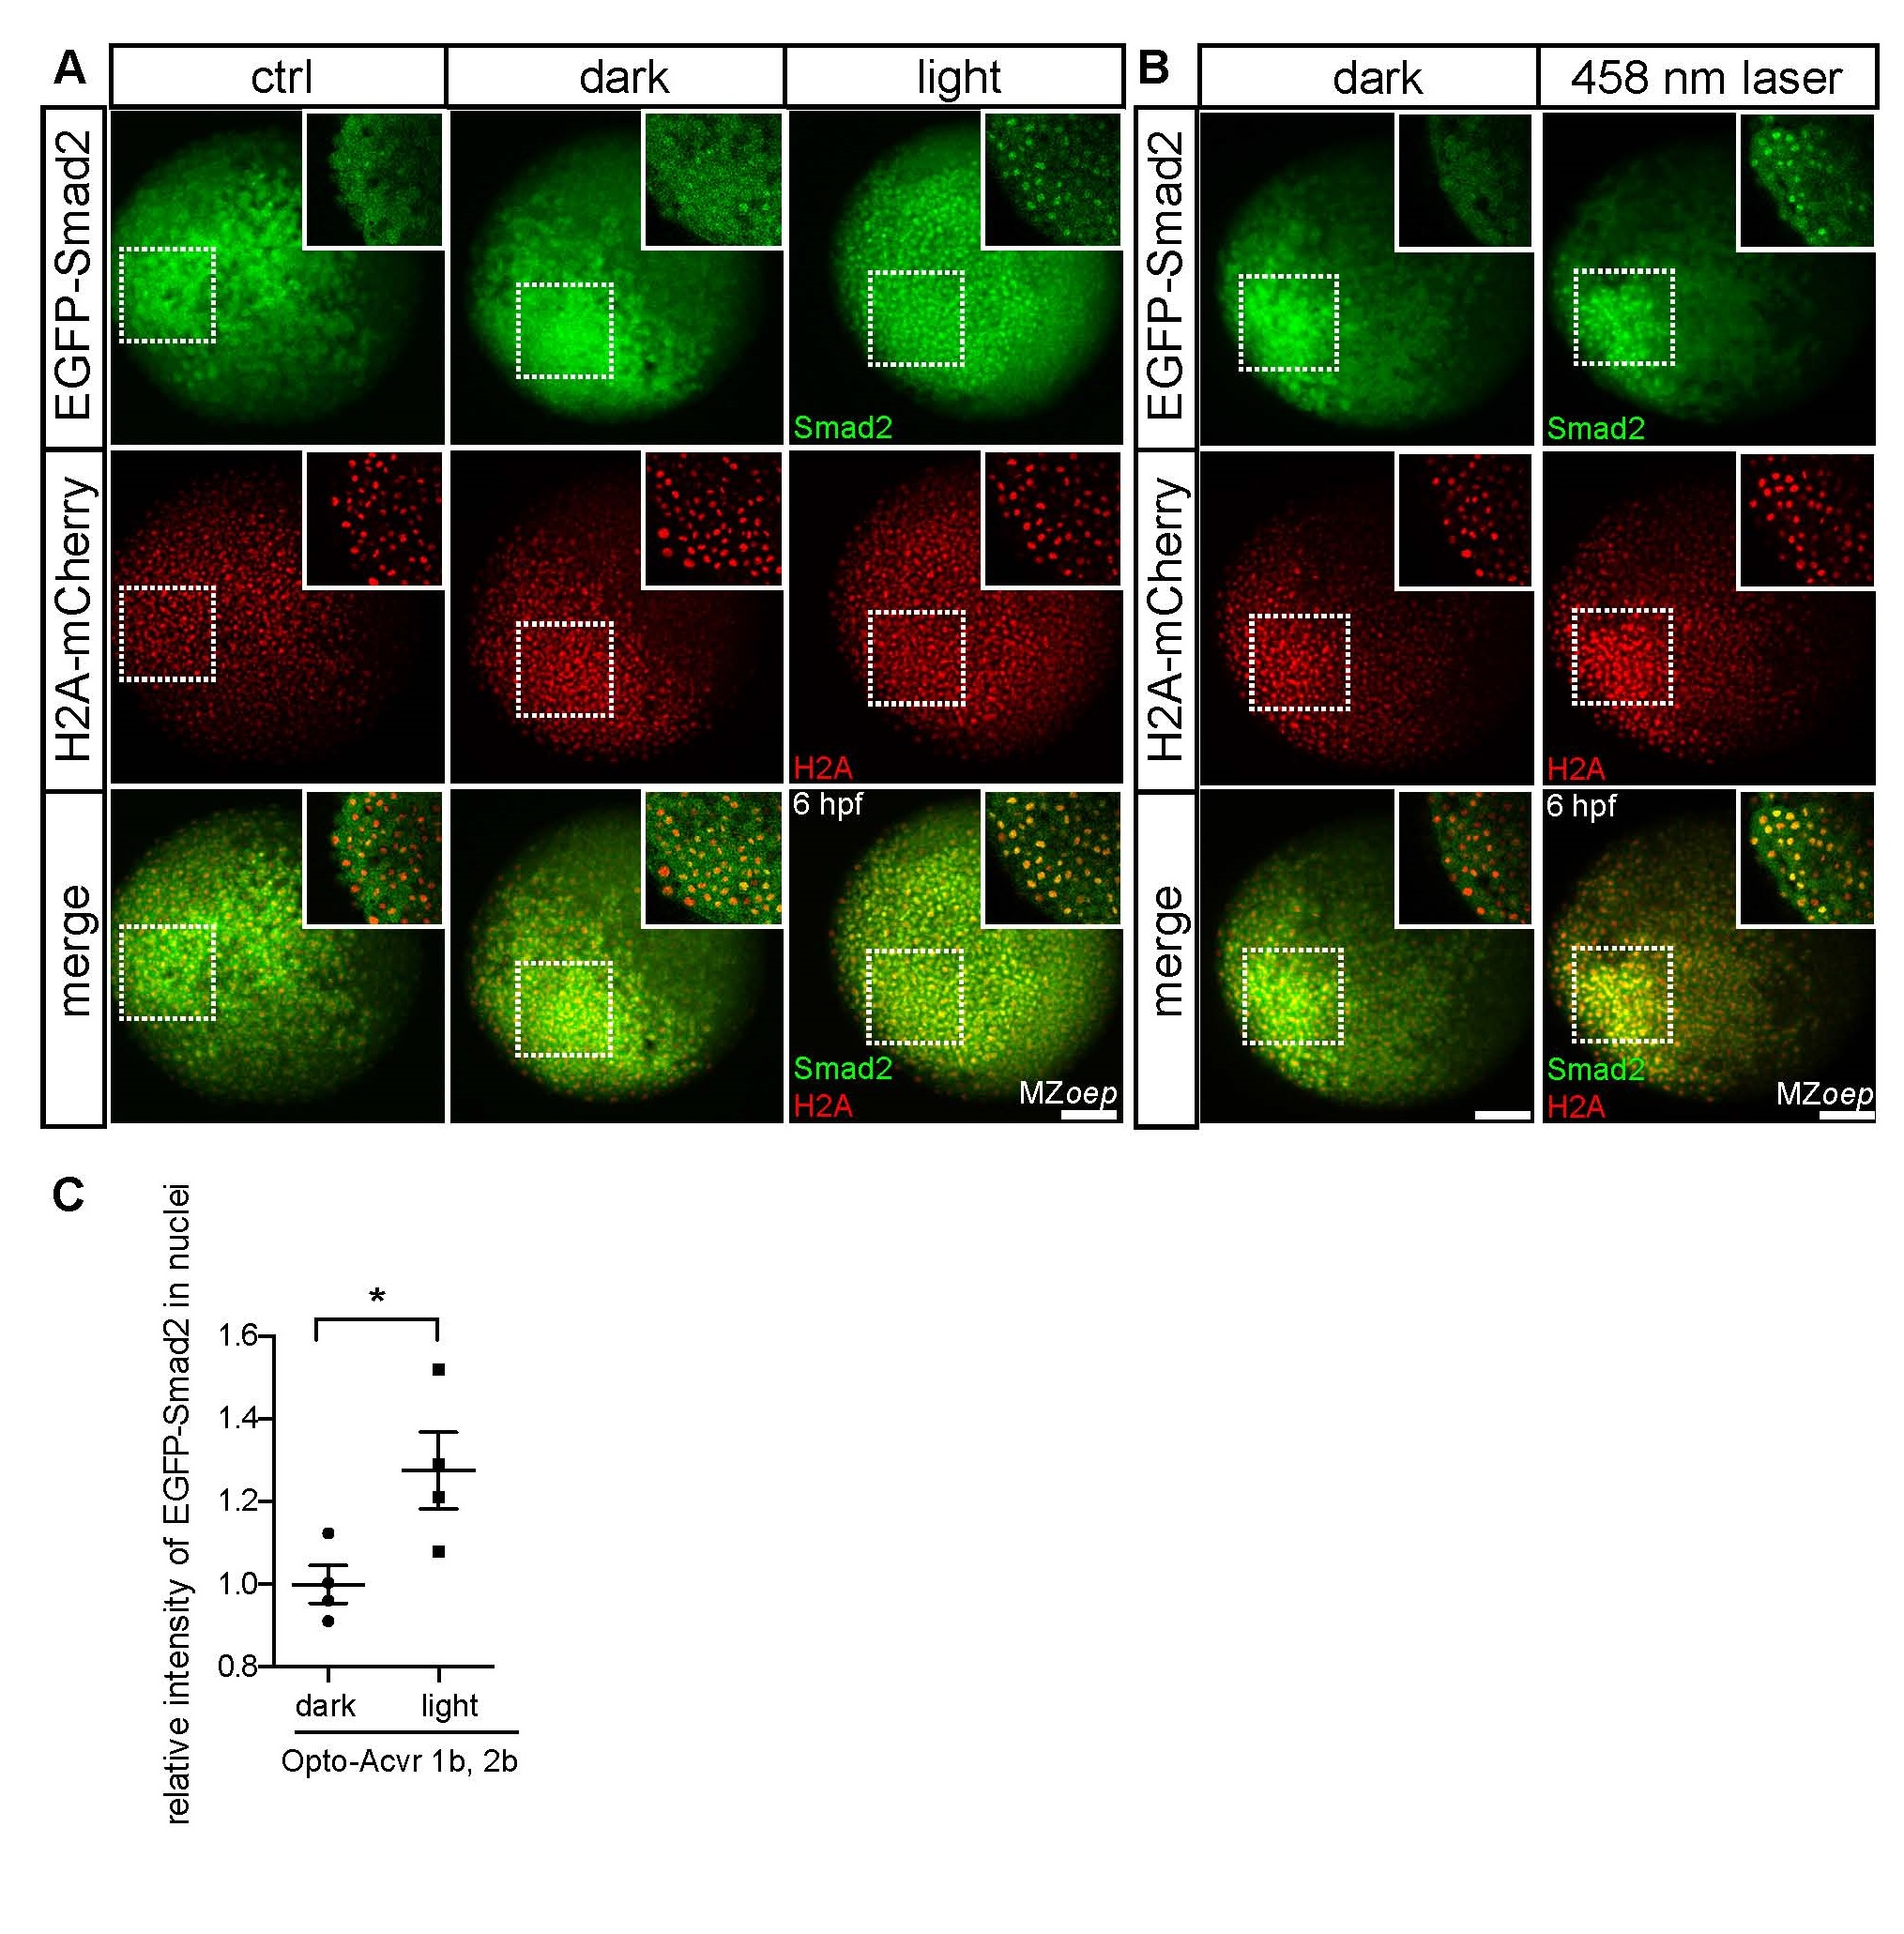
Nuclear localization of EGFP-smad2 by opto-acvr 1b and 2b activation. (A) Projection of image stacks showing the localization of EGFP-smad2 in shield stage (6 hpf) MZoep embryos injected with EGFP-smad2 (20pg), H2A-mCherry (20 pg) and opto-acvr 1b and 2b (20 pg each) mRNAs; animal pole views; control (ctrl) embryos were injected with EGFP-smad2 and H2A-mCherry only; embryos were exposed to light from high to shield stage (36 hpf); insets at the top-right of each panel show single image planes of the boxed region in the main panel; EGFPsmad2 and H2AmCherry are shown in green and red, respectively; scale bar, 100 µm. (B) Projection of image stacks showing the localization of EGFP- smad2 in shield stage (6 hpf) MZoep embryos injected with EGFP-smad2 (20pg), H2A-mCherry (20 pg) and opto-acvr 1b and 2b (20 pg each) mRNA; embryos were stimulated with a 458 nm laser from high to shield stage (36 hpf); EGFP- smad2 and H2AmCherry are shown in green and red, respectively; insets in at the top-right of each panel show single image planes of the boxed region in the main panel; scale bar, 100 µm. (C) Quantification of nuclear EGFP-smad2 signal in (B); mean ± SEM; n (dark) = 4, n (light) = 4 embryos, t-test was used for the statistical evaluation with p* < 0.05.