
|
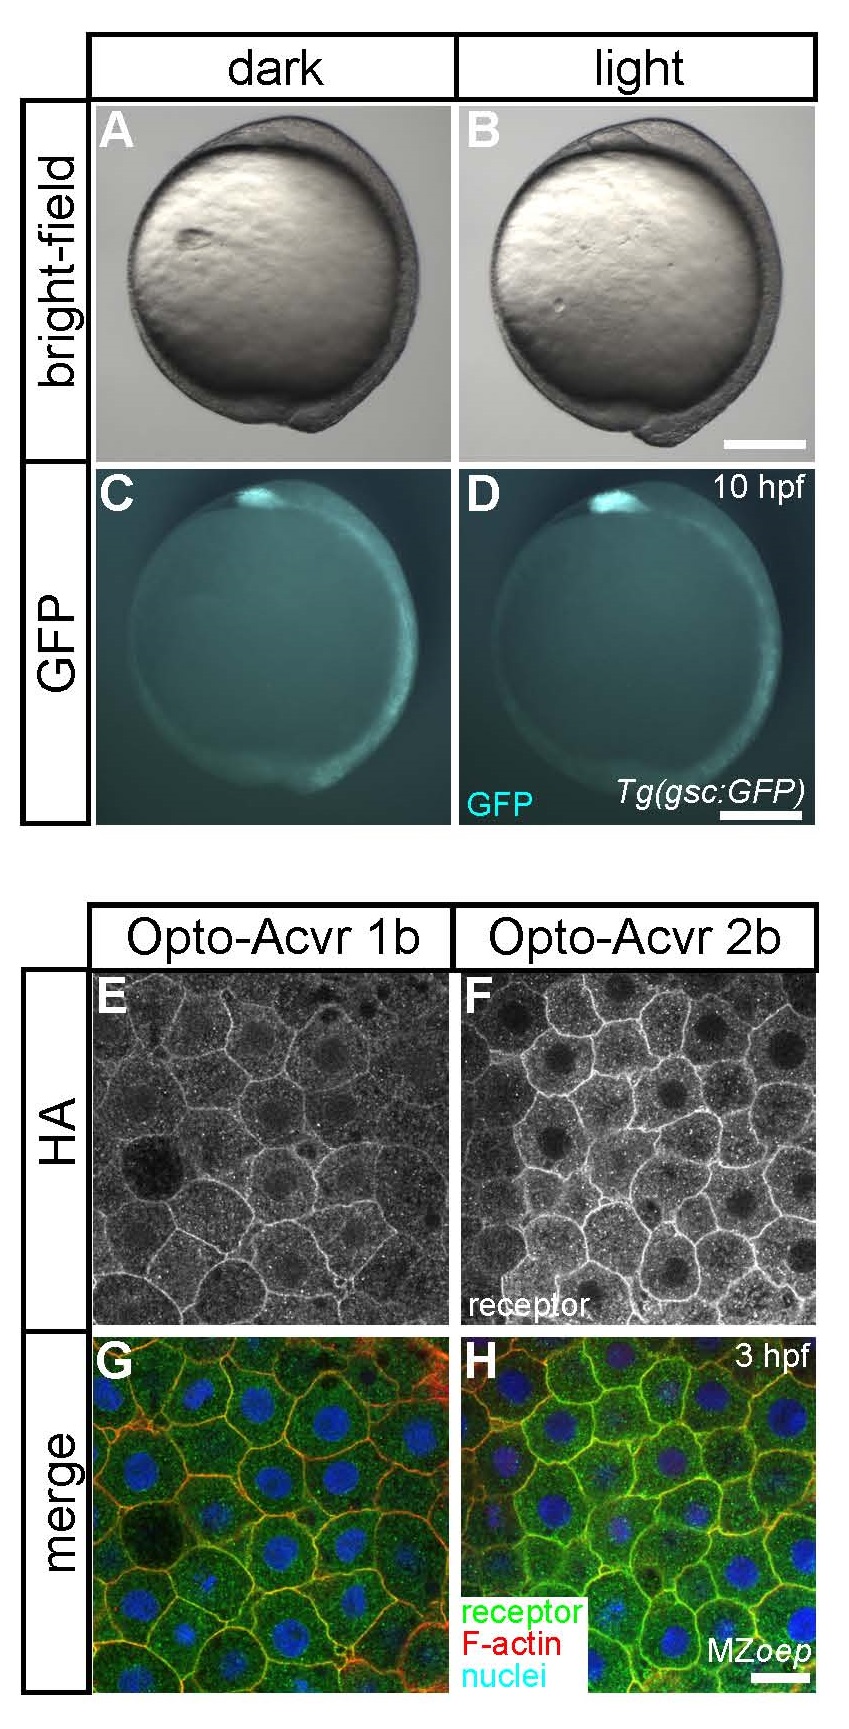
Fig. S1
Embryo light exposure and subcellular localization of Opto-acvr 1b and 2b. (A-D) Tg(gsc:GFP) embryos at bud stage (10 hpf) either kept in the dark (A, C) or exposed to blue LED light (B, D; 5.12 µW/mm2, see material and methods) from 2-cell to bud stage (0.510 hpf); upper (A, B) and lower (C, D) panels show bright-field and fluorescent images, respectively; scale bar, 200 µm. (EH) Anti- HA (Opto-acvr 1b- or 2bHA), phalloidin (filamentous actin), and DAPI (nuclei) staining of cells at the animal pole of optoacvr 1b or 2b mRNA (20 pg each)- injected MZoep embryos at high stage (3 hpf); scale bar, 20 µm.