
FIGURE
Fig. S1
- ID
- ZDB-FIG-160819-31
- Publication
- Sako et al., 2016 - Optogenetic Control of Nodal Signaling Reveals a Temporal Pattern of Nodal Signaling Regulating Cell Fate Specification during Gastrulation
- Other Figures
- All Figure Page
- Back to All Figure Page
Fig. S1
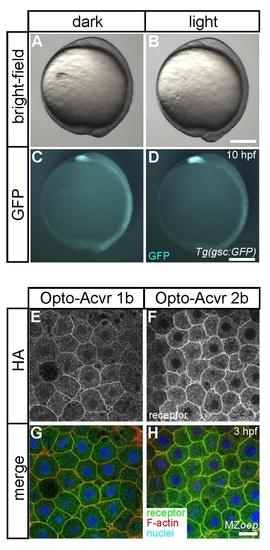
Embryo light exposure and subcellular localization of Opto-acvr 1b and 2b. (A-D) Tg(gsc:GFP) embryos at bud stage (10 hpf) either kept in the dark (A, C) or exposed to blue LED light (B, D; 5.12 µW/mm2, see material and methods) from 2-cell to bud stage (0.510 hpf); upper (A, B) and lower (C, D) panels show bright-field and fluorescent images, respectively; scale bar, 200 µm. (EH) Anti- HA (Opto-acvr 1b- or 2bHA), phalloidin (filamentous actin), and DAPI (nuclei) staining of cells at the animal pole of optoacvr 1b or 2b mRNA (20 pg each)- injected MZoep embryos at high stage (3 hpf); scale bar, 20 µm. |
Expression Data
Expression Detail
Antibody Labeling
Phenotype Data
Phenotype Detail
Acknowledgments
This image is the copyrighted work of the attributed author or publisher, and
ZFIN has permission only to display this image to its users.
Additional permissions should be obtained from the applicable author or publisher of the image.
Full text @ Cell Rep.