
Fig. 2
- ID
- ZDB-FIG-160819-28
- Publication
- Sako et al., 2016 - Optogenetic Control of Nodal Signaling Reveals a Temporal Pattern of Nodal Signaling Regulating Cell Fate Specification during Gastrulation
- Other Figures
- All Figure Page
- Back to All Figure Page
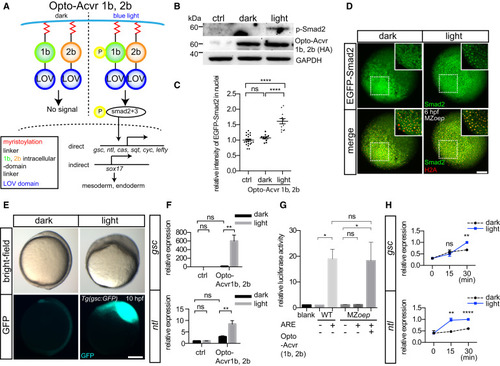
Construction and Validation of Photoactivatable Nodal Receptors (A) Schematic illustration of the photoactivatable Nodal receptor constructs and their function; LOV domain is shown in blue, and intracellular domains of acvr1b and acvr2b are shown in green and orange, respectively; both receptors are anchored to the plasma membrane by a myristoylation motif shown in red; under blue light stimulation, the 1b and 2b receptors are dimerized, leading to the phosphorylation of smad2 and smad3 and activation of target gene expression. (B) Western blot showing the expression of phosphorylated smad2, Opto-acvr1b, Opto-acvr2b, and GAPDH at dome stage (5 hpf) in MZoep injected with opto-acvr1b and opto-acvr2b mRNA (20 pg each); water-injected embryos were used as controls (ctrl); embryos were exposed to light from high to dome stage (3-5 hpf). (C) Quantification of nuclear EGFP-smad2 signal in shield stage (6 hpf) MZoep embryos injected with EGFP-smad2 (20 pg), H2A-mCherry (20 pg), and opto-acvr1b and opto-acvr2b mRNA (20 pg each) shown in (D); mean ± SEM; n (ctrl) = 22, n (dark) = 10, n (light) = 12 embryos; ANOVA test was used for the statistical evaluation with ****p < 0.0001; ns, not significant; MZoep embryos injected with EGFP-smad2 and H2A-mCherry mRNA only were used as ctrl. (D) Projection of image stacks showing the localization of EGFP-smad2 in shield stage (6 hpf) MZoep embryos injected with EGFP-smad2 (20 pg), H2A-mCherry (20 pg), and opto-acvr1b and opto-acvr2b mRNA (20 pg each); animal pole views; embryos were exposed to blue LED light from high to shield stage (3-6 hpf); insets at the top right of each panel show single image planes of the boxed region in the main panel; EGFP-smad2 and H2A-mCherry are shown in green and red, respectively. Scale bar, 100 µm. (E) Tg(gsc:GFP) embryos at bud stage (10 hpf) injected with opto-acvr1b and opto-acvr2b mRNA (20 pg each); embryos were exposed to blue LED light from two-cell to bud stage (0.5-10 hpf); upper panels are bright-field images and lower panels show gsc:GFP expression. Scale bar, 200 µm. (F) Relative expression levels of gsc and ntl mRNA at shield stage (6 hpf) in MZoep mutant embryos injected with opto-acvr1b and opto-acvr2b mRNA (20 pg each); embryos were exposed to light from two cell to shield stage (0.5-6 hpf); values are fold-induction compared to water-injected MZoep mutant embryos kept in dark; mean ± SEM; independent triplicate experiments; ANOVA test was used for the statistical evaluation with **p < 0.01; ns, not significant. (G) Quantification of luciferase activity induced by activin response element (ARE)-driven luciferase expression in wild-type (WT) and MZoep mutant embryos injected with 3× ARE-lux plasmid (12.5 pg) and opto-acvr1b and opto-acvr2b mRNA (20 pg each); embryos were exposed to light from high to shield stage (3–6 hpf); values are fold-induction compared to water-injected WT ctrl embryos; mean ± SEM; independent triplicate experiments; ANOVA test was used for the statistical evaluation with p < 0.05; ns, not significant. (H) Relative expression levels of gsc and ntl mRNA at 5, 5.25 and 5.5 hpf in MZoep embryos injected with opto-acvr1b and opto-acvr2b mRNA (20 pg each). Embryos were first exposed to light from sphere to dome stage (4-5 hpf) and then kept either in the dark or light for another 15 or 30 min; p values were determined between embryos kept in the dark and light at 15 and 30 min with t test; values are fold-induction over embryos at 5.5 hpf kept in the light; mean ± SEM; independent triplicate experiments; **p < 0.01; ns, not significant. See also Figures S1, S2, and S3. |