
Image
|
Figure Caption
Fig. S3
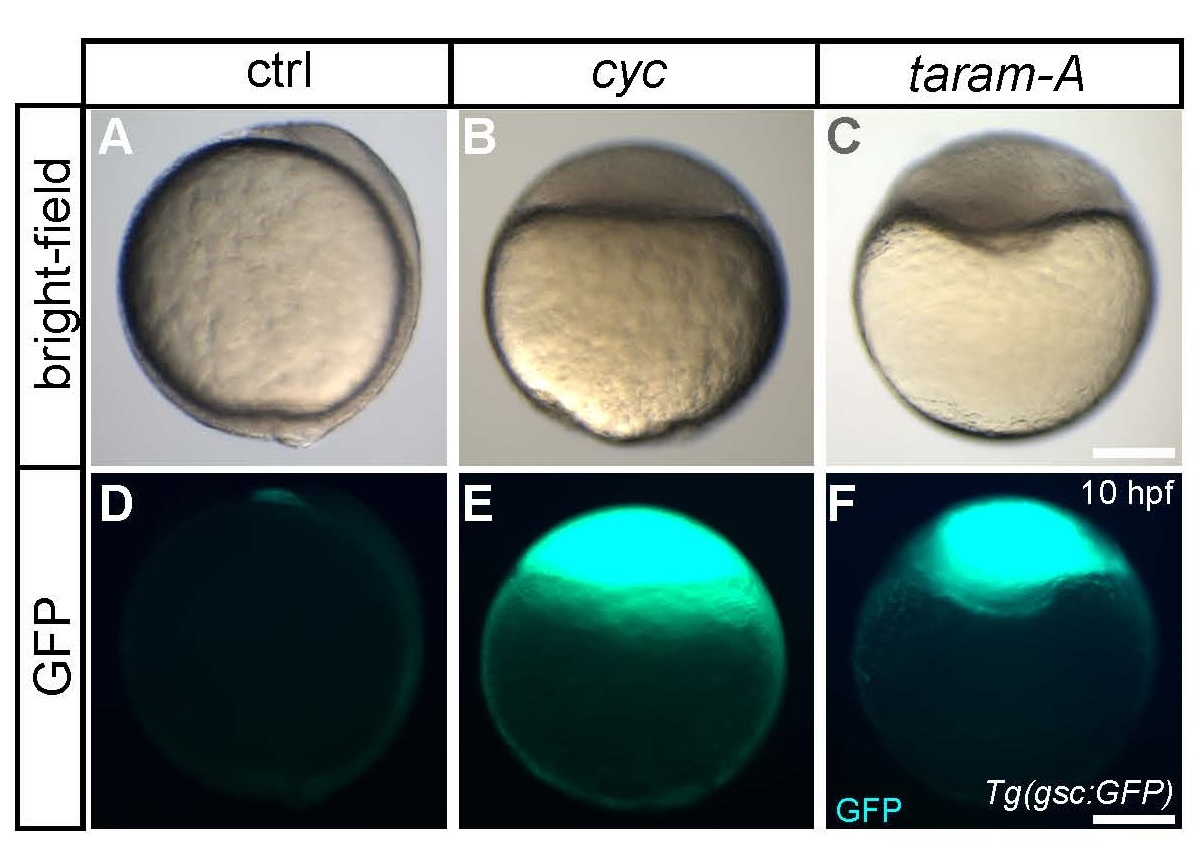
Activation of Nodal signaling by Cyc and TARAM-A overexpression (A-F) Tg(gsc:GFP) embryos at bud stage (10 hpf) injected with either cyc (B, E; 100pg) or taram-A (C, F; 5 pg) mRNA; waterinjected embryos were used as controls (A, D; ctrl); upper (AC) and lower (D-F) panels show bright-field and fluorescent images, respectively; scale bar, 200 µm.
Acknowledgments
This image is the copyrighted work of the attributed author or publisher, and
ZFIN has permission only to display this image to its users.
Additional permissions should be obtained from the applicable author or publisher of the image.
Full text @ Cell Rep.