
|
Fig. 5
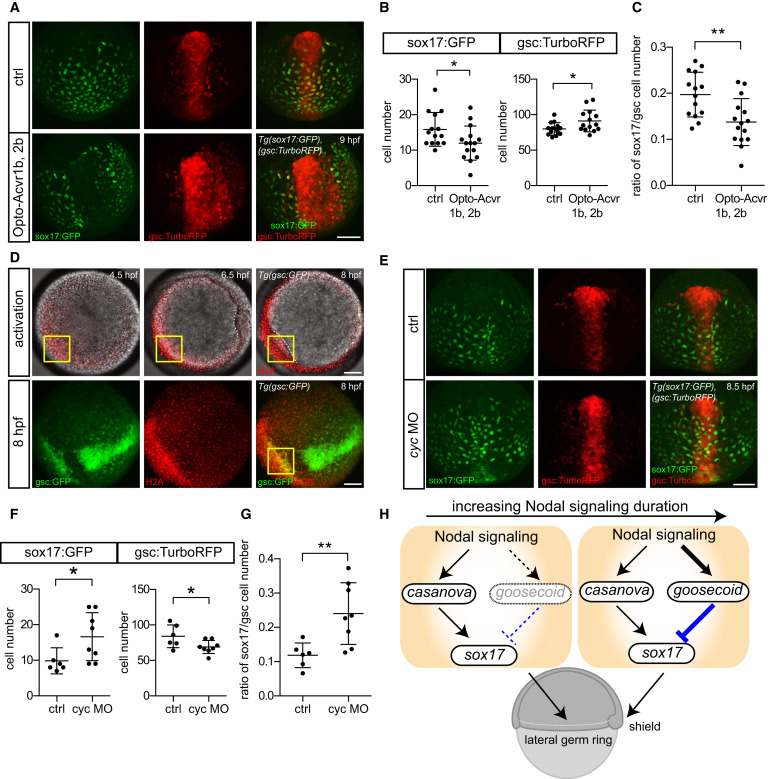
Endogenous Nodal Signaling Duration and Cell Fate Specification
(A) sox17:GFP and gsc:TurboRFP expression in opto-acvr1b and opto-acvr2b mRNA (20 pg each) injected Tg(sox17:GFP;gsc:TurboRFP) embryos at 90% epiboly stage (9 hpf); embryos were activated with blue LED from 5-6.5 hpf; dorsal views; water-injected embryos were used as controls (ctrl). Scale bar, 100 µm.
(B) Number of sox17:GFP and gsc:TurboRFP positive cells within the prechordal plate (ppl) region (200 µm2 around the ppl center) for embryos shown in (A) at 9 hpf; n (ctrl) = 14, n (Opto-acvr1b, Opto-acvr2b) = 15 embryos; mean ± SD; t test was used for the statistical evaluation with p* < 0.05.
(C) Ratio of sox17:GFP to gsc:TurboRFP expressing cells within the ppl region for embryos shown in (B) at 9 hpf; n (ctrl) = 14, n (Opto-acvr1b, Opto-acvr2b) = 15 embryos& mean ± SD; t test was used for the statistical evaluation with **p < 0.01.
(D) Activation of ectopic gsc:GFP expression in opto-acvr1b and opto-acvr2b mRNA (20 pg each) and H2A-mCherry (20 pg) injected Tg(gsc:GFP) embryos at 4.5, 6.5, and 8 hpf; gsc:GFP in green and H2A-mCherry outlining nuclei in red; Nodal signaling was activated in a spatially restricted area (yellow box; 150 µm2) within the ventral germ ring margin using a 458 nm laser from 4.5-8 hpf (top panels); dashed white lines indicate endogenous (top middle) and induced (top right) leading edge ppl cells; bottom panel shows image stack projections of gsc:GFP and mCherry (nuclei) expression in activated embryos at 8 hpf; animal pole view. Scale bar, 100 µm.
(E) sox17:GFP and gsc:TurboRFP expression in cyc morphant (cyc MO) (0.5 ng/embryo) Tg(sox17:GFP;gsc:TurboRFP) at 80% epiboly stage (8.5 hpf); water-injected embryos were used as ctrl; dorsal views.
(F) Number of sox17:GFP and gsc:TurboRFP positive cells within the ppl region (200 µm2 around the ppl center) for embryos shown in (E) at 8.5 hpf; n (ctrl) = 6, n (cyc MO) = 8 embryos; mean ± SD; t test was used for the statistical evaluation with *p < 0.05.
(G) Ratio of sox17:GFP to gsc:TurboRFP expressing cells within the ppl region for embryos shown in (F) at 8.5 hpf; n (ctrl) = 6, n (cyc MO) = 8 embryos; mean ± SD; t test was used for the statistical evaluation with **p < 0.01.
(H) Schematic illustration of changes in the induction of genes involved in mesendoderm cell fate specification as a function of endogenous Nodal signaling duration.
See also Movie S4.