
|
Fig. 1
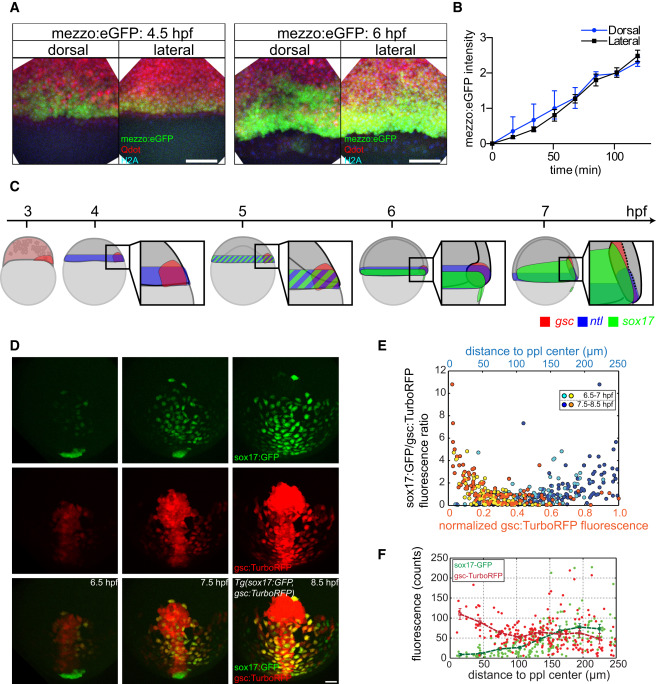
Temporal Nodal Signaling Activity and Cell Fate Specification
(A) Projection of image stacks showing mezzo:eGFP expression in the germ ring of Tg(mezzo:eGFP) embryos at 4.5 and 6 hpf injected with Qdots and expressing H2A-tagBFP to mark nuclei; dorsal and lateral views. Scale bar, 100 µm.
(B) Relative intensity of mezzo:eGFP in Tg(mezzo:eGFP) embryos at dorsal (blue line) and lateral side (black line) of the germ ring from 4.5-6.5 hpf; n = 3 embryos each.
(C) Schematic illustration of cell fate specification in zebrafish embryos at blastula and gastrula stages (3-7 hpf). gsc, ntl, and sox17 expression domains are shown in red, blue, and green, respectively; dorsal germ ring margin (shield) at 4-6 hpf is magnified in the boxed areas next to the illustrations of whole embryos; dorsal side is to the right.
(D) Projection of image stacks showing sox17:GFP and gsc:TurboRFP expression in Tg(sox17:GFP;gsc:TurboRFP) embryos at 6.5, 7.5, and 8.5 hpf. Scale bar, 50 µm.
(E) Ratio of single cell sox17:GFP/gsc:TurboRFP fluorescence intensity values as a function of either normalized TurboRFP fluorescence intensities (yellow and orange dots), or distance to the prechordal plate (ppl) center measured within a distance of 250 µm around the ppl center (light and dark blue dots) in Tg(sox17:GFP; gsc:TurboRFP) embryos between 6.5-8.5 hpf; data were pooled for different time spans of development with yellow and light blue = 6.5-7 hpf and orange and dark blue = 7.5-8.5 hpf; single cell gsc:TurboRFP fluorescence values on the x axis were normalized to the maximum average single cell fluorescence intensity at each selected time point; n = 4 embryos and n = 208 cells.
(F) Single cell sox17:GFP (green) and gsc:TurboRFP (red) fluorescence intensity values as a function of distance to the ppl center used for calculating the fluorescence ratio in (E); binned data are shown as green and red lines; error bar, mean ± SEM.
See also Movies S1, S2, and S3.