
|
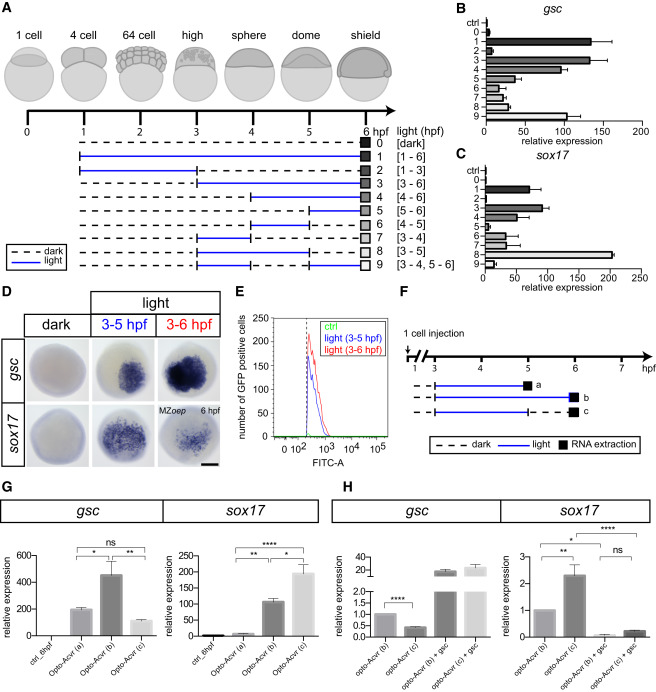
Fig. 3
Temporally Patterned Nodal Signaling Activation and Cell Fate Specification
(A) Schematic illustration of temporally patterned blue LED light stimulation of Opto-acvr1b and 2b signaling; blue continuous lines indicate light stimulation (light), and black dashed lines indicate no stimulation (dark); mRNA expression analysis was done at 6 hpf (boxes).
(B and C) Relative expression levels of gsc (B) and sox17 (C) mRNA in shield stage (6 hpf) MZoep embryos injected with opto-acvr1b and opto-acvr2b mRNA (20 pg each) and exposed to blue LED light using the temporal patterns shown in (A); gene expression levels were quantified by qPCR; water-injected embryos were used as controls (ctrl); sample numbers correspond to the numbers of the different stimulation patterns shown in (A); values are fold-induction compared to ctrl embryos; mean ± SEM; independent triplicate experiments.
(D) Expression of gsc and sox17 mRNA detected by whole-mount in situ hybridization in shield stage (6 hpf) MZoep embryos injected with opto-acvr1b and opto-acvr2b mRNA (20 pg each); embryos were kept in the dark or activated with blue LED light from either high to dome stage (3-5 hpf) or high to shield stage (3-6 hpf); animal pole views. Scale bar, 200 µm.
(E) FACS analysis of MZoep;Tg(gsc:GFP) embryos at shield stage (6 hpf) injected with opto-acvr1b and opto-acvr2b mRNA (20 pg each) and activated with blue LED light from either high to dome stage (3-5 hpf) or high to shield stage (3-6 hpf); non-injected embryos were used as ctrl; intensity of gsc:GFP and number of gsc:GFP positive cells were plotted on the x and y axes, respectively.
(F) Schematic illustration of temporally patterned blue LED light stimulation of Opto-acvr1b and Opto-acvr2b signaling; blue continuous lines indicate light stimulation (light), and black dashed lines indicate no stimulation (dark); black box marks time point of mRNA expression analysis.
(G) MZoep embryos injected with opto-acvr1b and opto-acvr2b mRNA (20 pg each) were stimulated using the temporal patterns shown in (F); expression levels of gsc and sox17 were determined by qPCR; water-injected embryos were used as ctrl; sample letters a-c correspond to the letters of the different stimulation patterns shown in (F); mean ± SEM; independent triplicate experiments, ANOVA test was used for the statistical evaluation with p < 0.05, **p < 0.01, ****p < 0.0001; ns, not significant.
(H) MZoep embryos injected with opto-acvr1b, opto-acvr2b mRNA (20 pg each), and gsc mRNA (20 pg) were stimulated using the temporal pattern b or c shown in (F); expression levels of gsc and sox17 were determined by qPCR at shield stage (6 hpf); values are fold-induction compared to opto-acvr1b and opto-acvr2b mRNA injected embryos stimulated using the temporal pattern b (3-6 hpf); mean ± SEM; independent quadruplicate experiments; for statistical evaluation t test was used for gsc expression (between temporal activation patterns b and c), and ANOVA test was used for sox17 expression with *p < 0.05, **p < 0.01, ****p < 0.0001; ns, not significant.
See also Figure S4 and Table S1.