
- Title
-
Caffeine reduces hepatic lipid accumulation through regulation of lipogenesis and ER stress in zebrafish larvae
- Authors
- Zheng, X., Dai, W., Chen, X., Wang, K., Zhang, W., Liu, L., Hou, J.
- Source
- Full text @ J. Biomed. Sci.
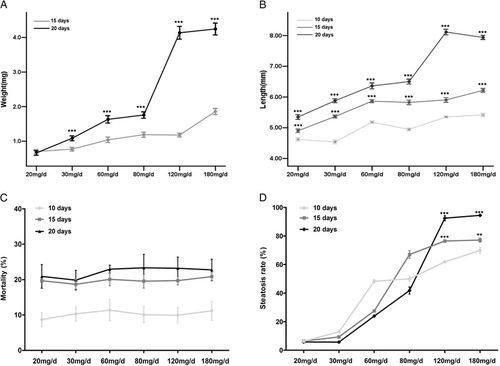
Effects of quantity and duration of feeding on growth and incidence of hepatic steatosis and mortality of zebrafish larvae. Body weight (a) and length (b) of zebrafish larvae were measured in different feeding groups for different feeding time (n = 80-91). c and d represent the effect of the quantity of feeding on mortality and hepatic steatosis rate in zebrafish larvae fed for different feeding time, respectively (n = 3). Data are expressed as mean ± SEM, **P < 0.01, ***P < 0.001 PHENOTYPE:
|
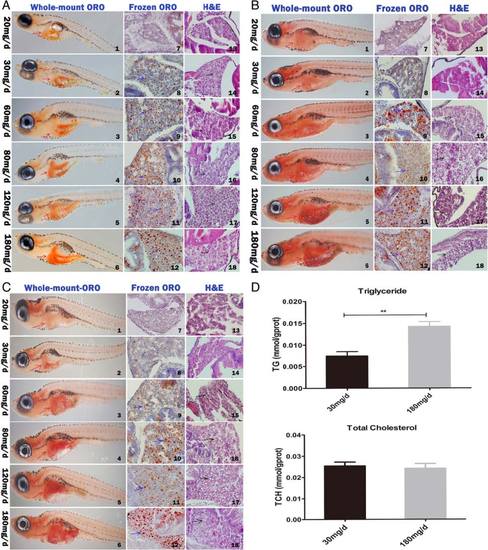
The liver histological changes of zebrafish larvae fed in different quantity of feeding and lipid contents in zebrafish. The histological change of liver in zebrafish larvae fed for 10 (a), 15 (b), and 20 (c) days was analyzed using Whole-mount oil red O staining (whole-mount ORO) (panels 1–6) (magnification × 32), frozen section oil red O staining (frozen ORO) (panels 7–12) (magnification × 400) and H&E staining (panels 13–18) (magnification × 400). Red arrows indicate zebrafish liver, blue arrows indicate lipid droplets, black arrows indicate vacuole lipid droplets. d Changes of triglyceride (TG) and total cholesterol (TCH) of zebrafish larvae fed for 20 days in 30 mg/d and 180 mg/d feeding group, Data are represented as mean ± SEM, n = 3. **P < 0.01 by Student’s t test PHENOTYPE:
|
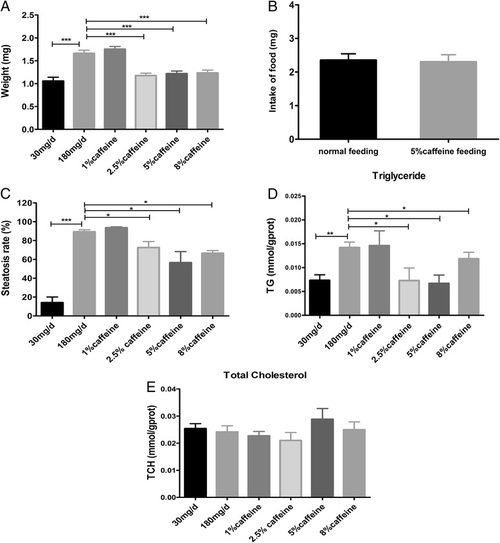
Effects of Caffeine on hepatic steatosis and lipid contents in overfed zebrafish larvae for 20 days. a The effects of caffeine on weight in zebrafish larvae overfed for 20 days. n = 2 clutches per group, n = 79-86 per clutch. b The food intake of 15 larvae in normal feeding and 5 % caffeine feeding group (n = 4). c Hepatic steatosis rate in zebrafish larvae overfed for 20 days (n = 3). The contents of triglyceride (d) and total cholesterol (e) were measured in zebrafish larvae overfed with different concentration of caffeine for 20 days (n = 3). Data is expressed as mean ± SEM. *P < 0.05, **P < 0.001, ***P < 0.001 by one-way ANOVA PHENOTYPE:
|
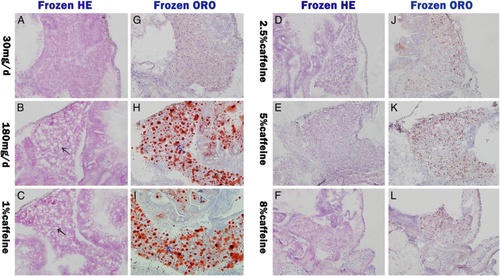
Effects of caffeine on hepatic lipid accumulation in zebrafish larvae overfed for 20 days. Frozen section hematoxylin and eosin staining (Frozen H&E) of liver sections in 30 mg/d (a), 180 mg/d (b), 1 % caffeine (c), 2.5 % caffeine (d), 5 % caffeine (e), and 8 % caffeine (f) feeding zebrafish larvae. Black arrow indicate lipid droplet. Frozen Oil red O staining (Frozen ORO) of liver sections in 30 mg/d (g), 180 mg/d (h), 1 % caffeine (i), 2.5 % caffeine (j), 5 % caffeine (k), and 8 % caffeine (l) feeding zebrafish larvae. Blue arrow indicate lipid droplet PHENOTYPE:
|
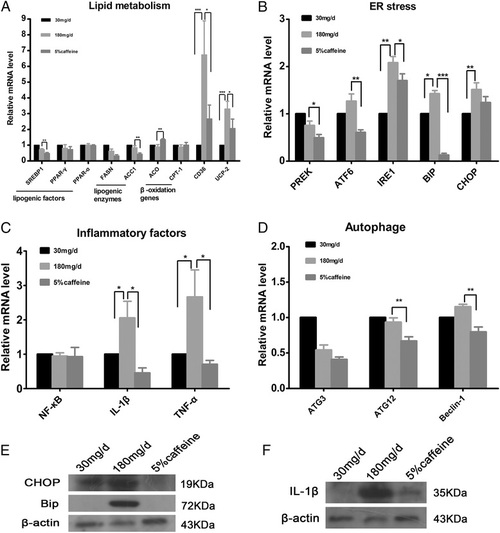
Effects of caffeine on the expression of selected genes in livers of zebrafish larvae overfed for 20 days. The relative mRNA expression of genes involved in lipid metabolism (a), ER stress (b), inflammatory factors (c), and autophage (d) in control (30 mg/d) and 5 % caffeine group compared with gene expression in model group (180 mg/d) by qRT-PCR. Expression analysis of the selected genes using cDNA prepared from liver of zebrafish larvae (n = 20) in each group. Data is expressed in mean ± SEM, n = 5. Protein expression of ER stress (e) and inflammatory factor (f) was examined by western blot in caffeine treatment and model group zebrafish larvae. * P < 0.05, * *P < 0.01, * * *P < 0.001 by one-way ANOVA EXPRESSION / LABELING:
PHENOTYPE:
|