
|
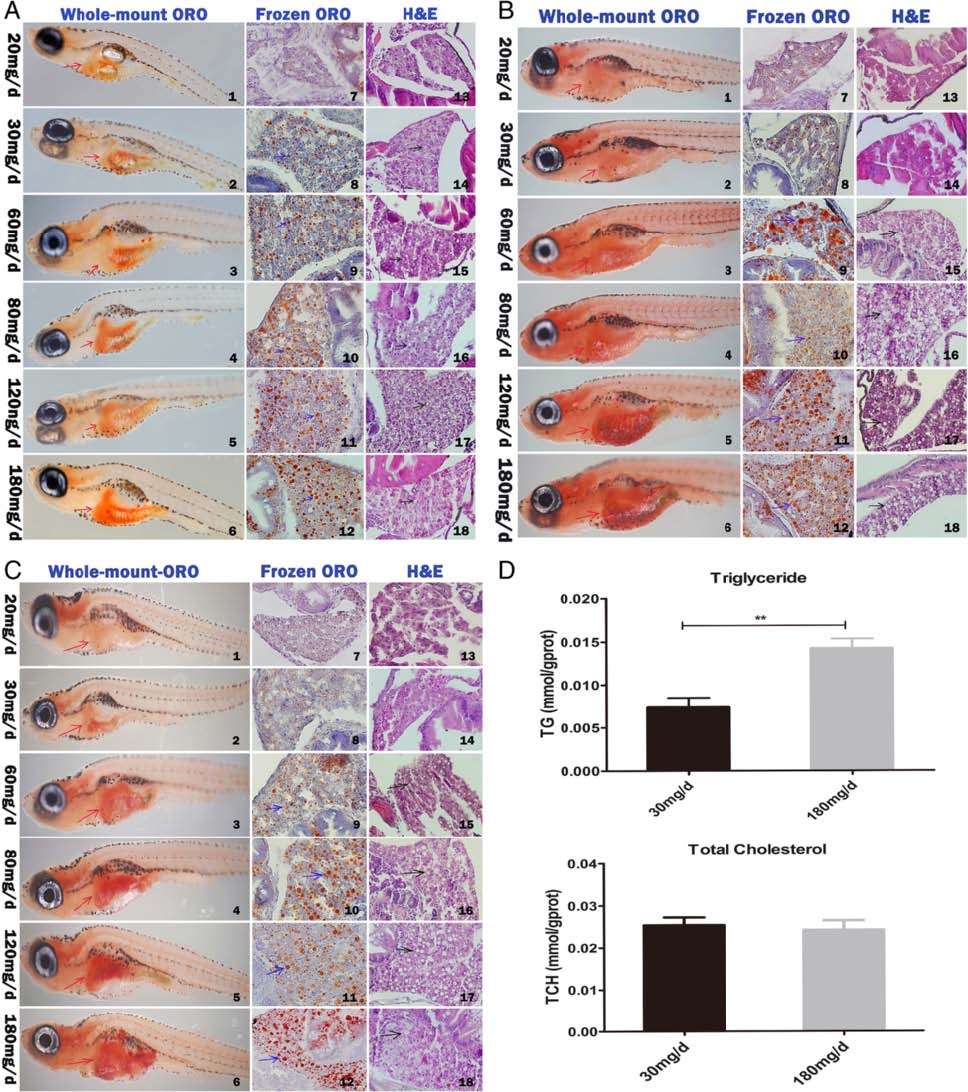
Fig. 2
The liver histological changes of zebrafish larvae fed in different quantity of feeding and lipid contents in zebrafish. The histological change of liver in zebrafish larvae fed for 10 (a), 15 (b), and 20 (c) days was analyzed using Whole-mount oil red O staining (whole-mount ORO) (panels 1–6) (magnification × 32), frozen section oil red O staining (frozen ORO) (panels 7–12) (magnification × 400) and H&E staining (panels 13–18) (magnification × 400). Red arrows indicate zebrafish liver, blue arrows indicate lipid droplets, black arrows indicate vacuole lipid droplets. d Changes of triglyceride (TG) and total cholesterol (TCH) of zebrafish larvae fed for 20 days in 30 mg/d and 180 mg/d feeding group, Data are represented as mean ± SEM, n = 3. **P < 0.01 by Student’s t test