
Fig. 5
|
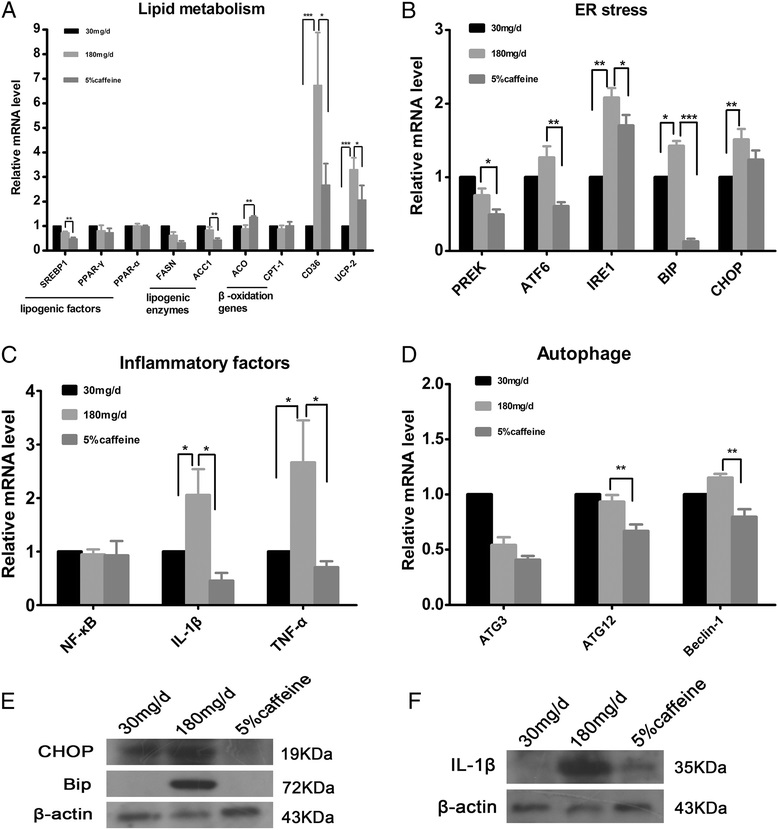
Fig. 5
Effects of caffeine on the expression of selected genes in livers of zebrafish larvae overfed for 20 days. The relative mRNA expression of genes involved in lipid metabolism (a), ER stress (b), inflammatory factors (c), and autophage (d) in control (30 mg/d) and 5 % caffeine group compared with gene expression in model group (180 mg/d) by qRT-PCR. Expression analysis of the selected genes using cDNA prepared from liver of zebrafish larvae (n = 20) in each group. Data is expressed in mean ± SEM, n = 5. Protein expression of ER stress (e) and inflammatory factor (f) was examined by western blot in caffeine treatment and model group zebrafish larvae. * P < 0.05, * *P < 0.01, * * *P < 0.001 by one-way ANOVA