
- Title
-
Both ciliary and non-ciliary functions of Foxj1a confer Wnt/β-catenin signaling in zebrafish left-right patterning
- Authors
- Zhu, P., Xu, X., Lin, X.
- Source
- Full text @ Biol. Open
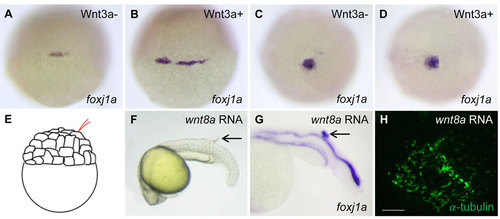
The effect of Wnt activation on foxj1a expression and cilia formation. (A-D) Wnt3a induction transiently enhances foxj1a levels in DFCs. Tg(hsp:wnt3a-GFP) embryos were heat activated at 30% epiboly for 30min, and GFP+ (Wnt3a+) embryos were selected under fluorescence microscope. foxj1a transcript levels were examined at 1h (A,B) and 4h (C,D) after heat shock. Shown are dorsal views of embryos at 50% epiboly (A,B) and 95% epiboly (C,D). (E-H) Targeted overexpression of Wnt8a results in ectopic foxj1a expression and ectopic cilia formation. Schematic diagram shows a single cell injection at the 128-cell stage (E). Injection of wnt8a mRNA (100pg) into a single cell at the 128-cell stage induced an ectopic protrusion (arrow in F), ectopic foxj1a expression (arrow in G, 8/8), and ectopic cilia-like structures as manifested by immunostaining using an antibody against acetylated α-tubulin (H). Whole-mount immunostaining was performed first, and then the protrusion was removed and imaged. Scale bar: 20µm. |
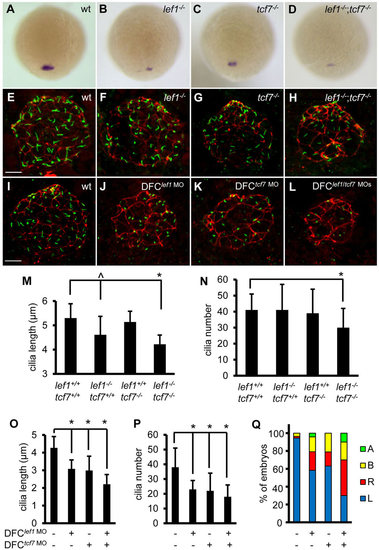
Lef1 and Tcf7 cooperatively regulate foxj1a expression and ciliogenesis. (A-D) Disruption of Lef1 or Tcf7 downregulates foxj1a expression in DFCs. foxj1a transcript levels were reduced in homozygous lef1 (lef1-/-) (B) or tcf7 (tcf7-/-) embryos (C) compared with wild-type siblings (A), and further decreased or abolished in double homozygous (lef1-/-;tcf7-/-) mutants (D). Shown are dorsal views of 95% epiboly staged embryos. Genotyping was performed on embryos that had been analyzed by in situ hybridization. (E-H) Disruption of Lef1 and Tcf7 affects ciliogenesis in KV. Embryos were fixed at the 12-somite stage, and the head regions were collected for genotyping. Then, immunostaining was performed on wild-type siblings and homozygous mutants. KV cilia were visualized by anti-acetylated α-tubulin staining (green) and apical-basal polarity of KV cells by anti-ZO-1 staining (red). (I-L) DFC-specific depletion of Lef1 or Tcf7 results in shorter and fewer cilia. lef1 MO (2ng) and/or tcf7 MO (2ng) were injected into the yolk cells at the 256-cell stage, and embryos were collected at the 10-somite stage for immunostaining. (M-P) Quantification of cilia length and number in mutants (M,N; 11–32 embryos were scored for each genotype) and morphants (O, P; 11–31 embryos were analyzed for each group). Data are represented as mean±s.d. (Q) DFC-specific depletion of Lef1 or Tcf7 randomizes left-sided spaw expression. Percentage of embryos with specific patterns of spaw expression was scored at the 21-somite stage. wt, wild type; A, absence; B, bilateral; L, left side; R, right side. ^P<0.05, * P<0.01 compared with controls. Scale bars: 20µm in E-L. |
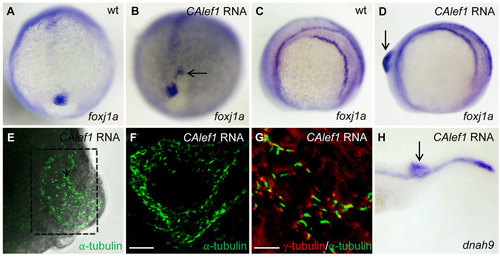
Targeted overexpression of CALef1 induces ectopic foxj1a and ectopic Cilia. (A, B) CAlef1 mRNA (100pg) was injected into 1-cell staged embryos. Ectopic foxj1a expression was observed (arrow in B). (C-H) CAlef1 mRNA (100pg) was injected into a single cell at the 128-cell stage of embryos. Embryos with an induced ectopic protrusion were collected at 10 to 14 somites (D-G) and 21 somites (H). The ectopic protrusion contained ectopic expression of foxj1a (arrow in D) and dnah9 (arrow in H), and ectopic structures positive for anti-acetylated α-tubulin antibody staining (E, indicated by a dotted box, 5× magnification; amplified in F, 20× magnification). α-tubulin staining (green) was adjacent to γ-tubulin staining (red) (G). Shown are images taken from dissected and flattened protrusions (E,F) and JB-4 sections of the protrusions (G). Scale bars: 20µm in F and 10µm in G. |
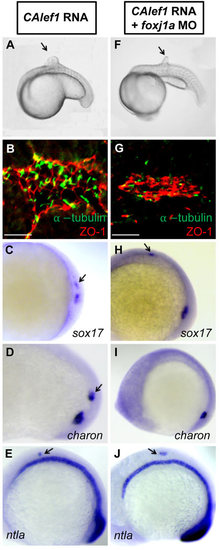
Foxj1a mediates CALef1-induced ectopic cilia formation, not tissue formation. (A-E) Injection of CAlef1 mRNA (100pg) into a single cell at the 128-cell stage resulted in formation of an ectopic protrusion (A), formation of ectopic cilia and ZO-1-positive cells (B), and ectopic expression of sox17 (C), charon (D), and ntla (E). (F-J) Coinjection of foxj1a MO (150pg) with CAlef1 mRNA (100pg) into a single cell at the 128-cell stage shortened ectopic cilia length (G) and abolished ectopic charon expression (I), but had no effect in the formation of an ectopic protrusion (F) or ectopic expression of ZO-1 (G), sox17 (H), and ntla (J). Shown are embryo morphology at the 16- to 20-somite stage (A and F), in situ staining at 10 somites (C-E,H-J), and JB-4 sections of the protrusions after whole-mount double immunohistochemical labeling using antibodies against ZO-1 (red) and acetylated α-tubulin (green) (B and G). The arrow indicates ectopic protrusions (A, F) and ectopic gene expression (C-E,H,J). Scale bars: 20µm. |
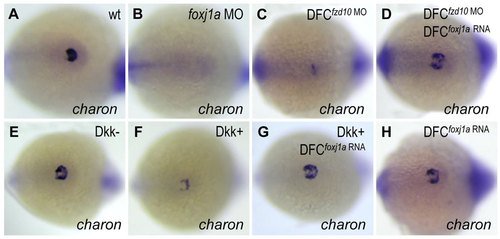
Foxj1a confers Wnt-regulated charon expression in KV. (A,B) Foxj1a is necessary for charon expression. Injection of foxj1a MO (2ng) into 1-cell staged embryos led to reduction of charon levels (B, 18/20). (C-H) Foxj1a overexpression rescues charon levels in embryos with reduced Wnt signaling. charon transcript levels were downregulated by DFC-targeted injection of fzd10 MO (4ng) (C, 28/29) and by Dkk1 induction (F, 26/30), which were restored by injection of foxj1a mRNA (2ng) (D, 23/28; G, 25/32). Injection of foxj1a mRNA alone did not significantly affect charon expression (H, 16/16). Tg(hsp:dkk1-GFP) embryos were heat shocked at 70% epiboly, and GFP+ (Dkk1+) embryos were selected under fluorescence microscope. Shown are dorsal views of tailbud region at 10 to 12 somites. |
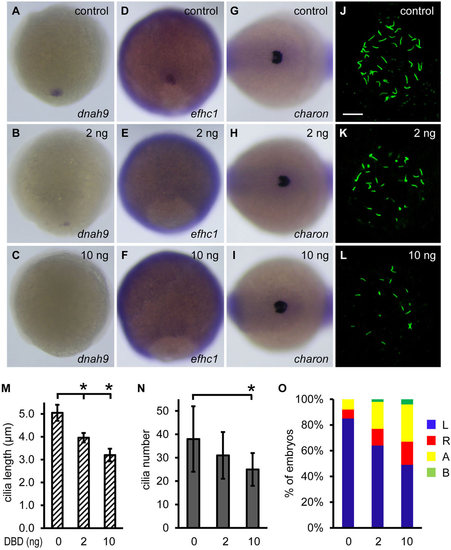
Non-ciliary function of Foxj1a regulates charon expression. (A-F) Overexpression of DBD-Foxj1a inhibits Foxj1a target gene expression. Injection of 2ng of DBD-Foxj1a mRNA suppressed dnah9 (B, 8/14) and efhc1 (E, 6/14) transcript levels, and injection of 10ng of mRNA nearly abolished dnah9 (C, 18/21) and efhc1 (F, 13/15) expression. Shown are dorsal views of 90% to 95% epiboly staged embryos. (G-I) Injection of DBD-Foxj1a mRNA did not affect charon expression at doses of either 2ng (H) or 10ng (I). Shown are dorsal views of tailbud region at 10 to 12 somites. (J-L) Overexpression of DBD-Foxj1a results in defective ciliogenesis. Shorter (K,L) and fewer (L) KV cilia were visualized at the 10-somite stage by anti-acetylated α-tubulin staining. Scale bar: 20µm. (M,N) Quantification of cilia length and number. 9 to 11 embryos were analyzed for each group. Data are represented as mean±s.d. *P<0.01 compared with controls. (O) Overexpression of DBD-Foxj1 randomizes left-sided spaw expression. Percentage of embryos with specific patterns of spaw expression was scored at the 21-somite stage. DBD, DNA-binding domain; A, absence; B, bilateral; L, left side; R, right side. |
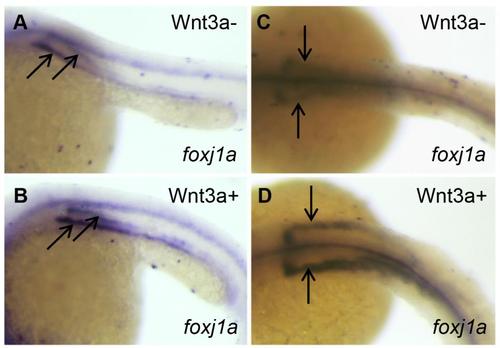
Activation of Wnt signaling enhances foxj1a transcript levels in the pronephros. Tg(hsp:wnt3a-GFP) embryos were heat activated at 18 somites for 60 minutes, and foxj1a transcript levels were examined at 2 hours (A and B) and 20 hours (C and D) after heat shock. Arrows show the developing pronephros. |
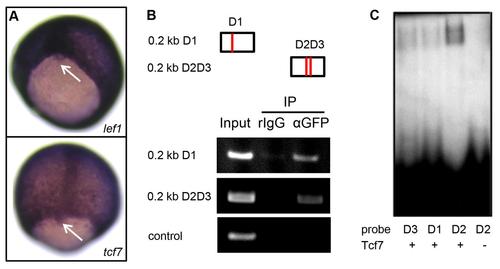
Lef1 and Tcf7 associate with foxj1a regulatory sequence. (A) lef1 and tcf7 are both expressed in DFCs (Arrow points to DFCs). (B) Lef1 coprecipitates with foxj1a regulatory sequence by a chromatin-immunoprecipitation assay. Briefly, embryos injected with hsp:lef1-GFP plasmid were heat shocked at 30% epiboly and collected at the bud stage. Anti-GFP antibody was used to immunoprecipitate Lef1-DNA complexes, and the recovered DNA was subjected to polymerase chain reaction analysis using primer pairs amplifying 2 approximately 0.2-kilobase (kb) fragments of the 0.6-kb foxj1a regulatory sequence. One DNA fragment harbors 1 putative Lef/Tcf binding site (D1), and the other fragment contains 2 sites (D2 and D3). A primer pair that amplifies a region more than 2 kb away from the enhancer sequence served as a negative control. (C) Tcf7 binds to the foxj1a regulatory sequence. A Tcf7-GST fusion protein (100 ng) was incubated with 32P–labeled oligonucleotides corresponding to D1, D2, and D3 sequences. The resulting products were loaded onto a 6% acrylamide non-denaturing gel. |
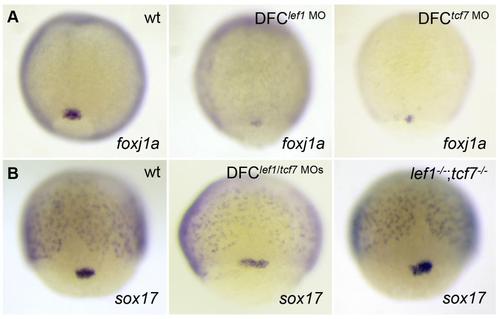
Lef1 and Tcf7 regulate foxj1a expression KV cell-autonomously. (A) DFClef1 MO or DFCtcf7 MO embryos had less foxj1a expression in DFCs. (B) sox17 was present in embryos depleted of Lef1 and Tcf7. wt indicates wild type. |
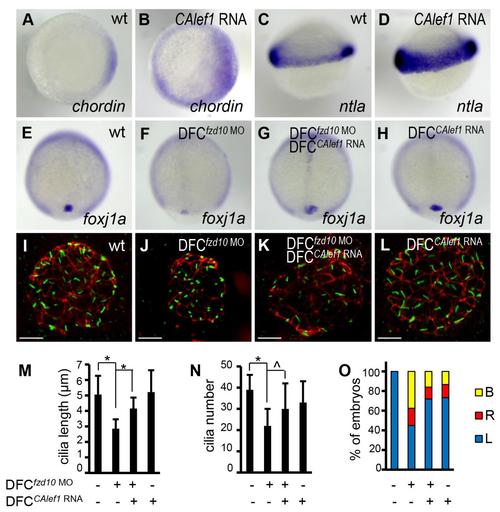
KV-specific expression of CALef1 rescues ciliogenesis and LR asymmetry defects in DFCfzd10 MO embryos. (A-D) Expression of CALef1 activates Wnt target gene expression. Injection of CAlef1 mRNA (100 pg) into 1-cell staged embryos expanded the expression of Wnt target gene chordin (B) and ntla (D). Shown are dorsal views (A and B) and lateral views (C and D) of 30%-epiboly staged embryos. (E-H) Ectopic expression of CALef1 rescues foxj1a levels in DFCfzd10 MO embryos. DFC-targeted injection of fzd10 MO (4 ng) downregulated foxj1a expression (F; 28/29). This downregulation was rescued by DFC-targeted CAlef1 mRNA injection (100 pg) (G; 20/30). Overexpression of CALef1 alone had no apparent effect on steady state foxj1a expression (H). (I-L) Ectopic expression of CALef1 rescues ciliogenesis in DFCfzd10 MO embryos. DFC-targeted injection of fzd10 MO (4 ng) reduced both cilia length and number (J). Coinjection of CAlef1 mRNA (100 pg) with fzd10 MO (4 ng) partially restored cilia length and number (K). Ectopic expression of CALef1 alone had no apparent effect on cilia length and number (L). Cilia were visualized by anti-acetylated α-tubulin staining (green) and apical-basal polarity of KV cells by anti-ZO-1 staining (red) in 10-somite staged embryos. (M and N) Quantification of cilia length (M) and number (N). Approximately 18 to 23 embryos were analyzed for each group. Data are represented as mean mean ± s.d. (O) Ectopic expression of CALef1 partially rescues left-sided spaw expression in DFCfzd10 MO embryos. Percentage of embryos with specific spaw expression patterns was determined in 21- somite staged embryos; 40 to 96 embryos per group were scored. B indicates bilateral; L, left side; R, right side. * indicates P<.01, and ^ indicates P<.05. Scale bar: 20 µm. |
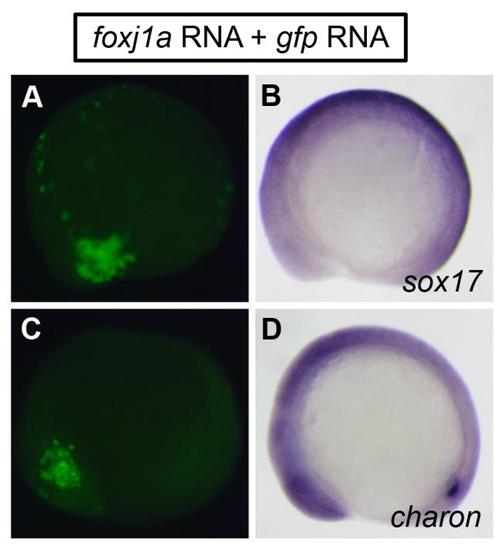
Effects of Foxj1a overexpression. Injection of foxj1a mRNA (100 pg) into a single cell at the 128-cell stage did not induce ectopic expression of sox17 (B) and charon (D). gfp RNA (100 pg) was coinjected to label cells overexpressing Foxj1a (A and C). Shown are lateral views of 10-somite staged embryos. Individual embryos were photographed for GFP fluorescent signals first, and then subjected to in situ hybridization. Signals of GFP fluorescence and in situ staining from the same embryos are shown in parallel. |
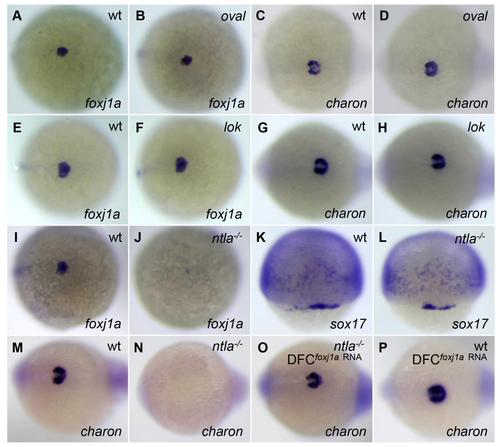
charon expression is correlated with Foxj1a, not cilia or cilia motility. (A-H) foxj1a and charon are normally expressed in oval (ift88tz288/tz288) and lok (ccdc40 to237b/to237b) mutants. All embryos derived from a heterozygous ift88tz288/+ or ccdc40to237b/+ incross displayed similar amounts of expression of foxj1a (A and B, E and F) and charon (C and D, G and H). Genotyping confirmed that wild-type embryos and homozygous mutants were all present in the clutch. (I-P) Transcript levels of foxj1a and charon are inhibited in homozygous ntlab195/b195 (ntla- /-) mutants. Approximately 25% of embryos derived from an ntlab195/+ incross lacked foxj1a expression (J) and charon expression (N). Genotyping confirmed them as ntla-/- mutants. sox17 was expressed in all progenies of ntlab195/+ incross (L). Moreover, all embryos from ntlab195/+ incross displayed charon expression after injection of foxj1a mRNA (2 ng) (O). Genotyping indicated that homozygous mutants were present in the clutch. ift88tz288/+ and ntlab195/+ fish were obtained from the Zebrafish International Resource Center, and ccdc40to237b/+ fish were provided by the Mayo Clinic Translational Polycystic Kidney Disease Center. Genotyping of ift88tz288/tz288, ccdc40to237b/to237b, ntlab195/b195 embryos was performed as previously described (Huang and Schier, 2009; Becker-Heck et al., 2011). Shown are dorsal views of embryos at 75% epiboly (K and L), 95% epiboly (A, B, E, F, I, and J), and tailbud region at 10 to 12 somites (C, D, G, H, and M-P). |