
|
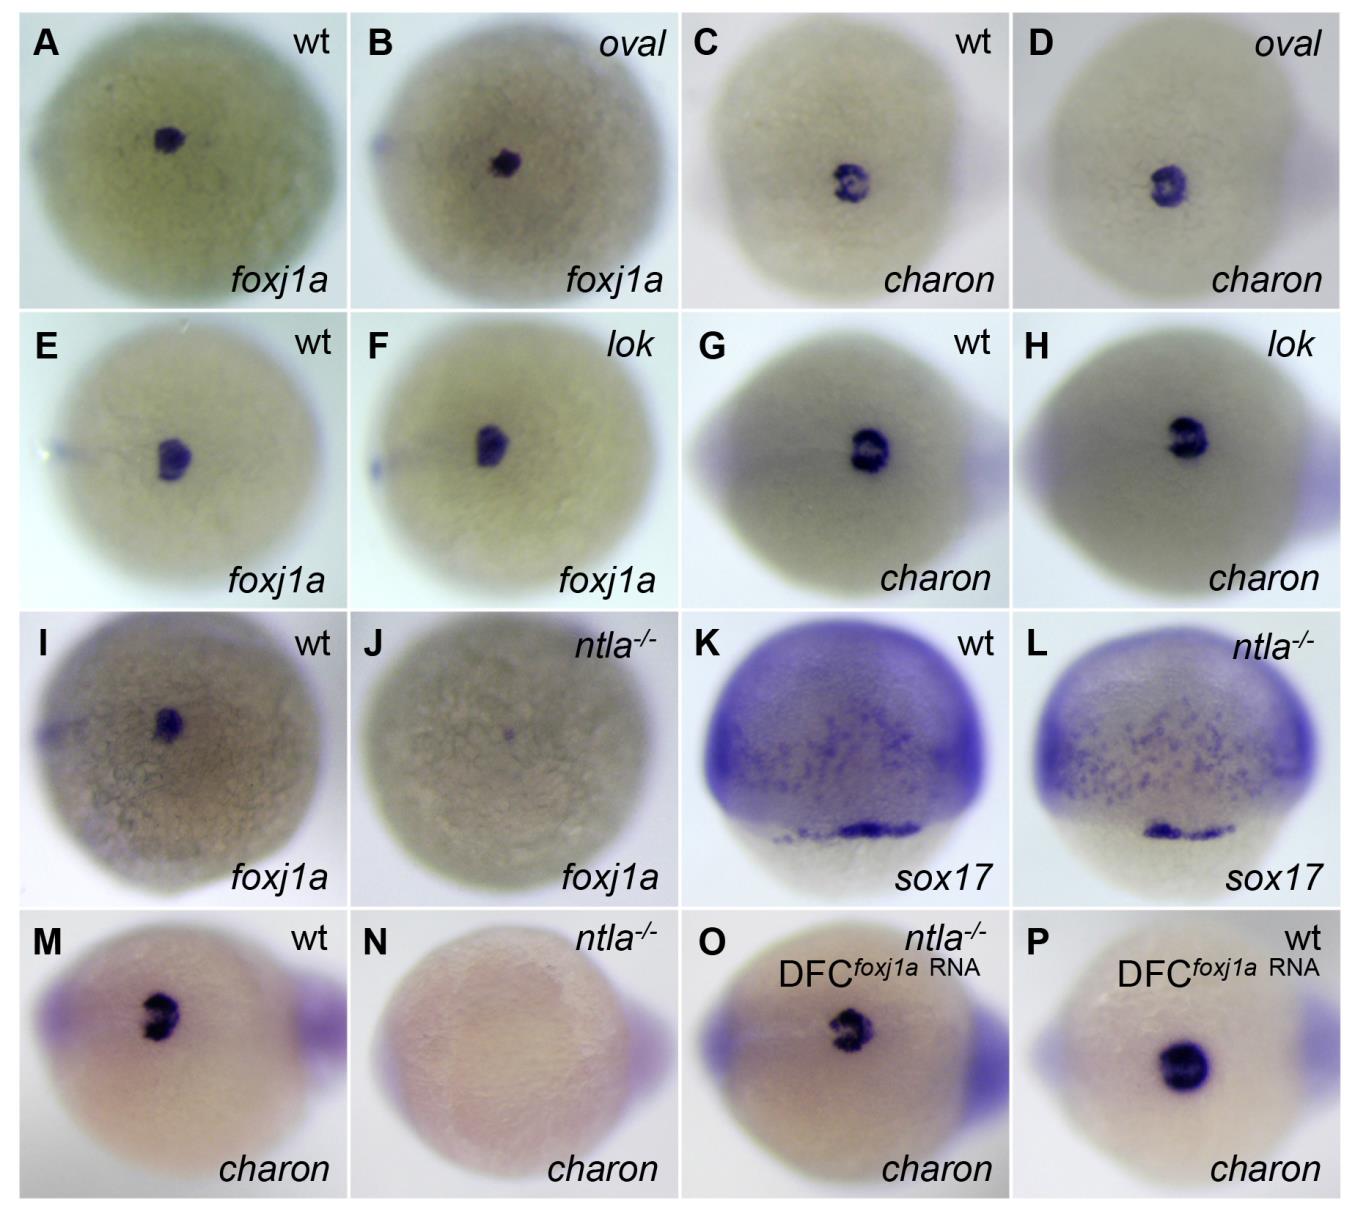
Fig. S7 charon expression is correlated with Foxj1a, not cilia or cilia motility. (A-H) foxj1a and charon are normally expressed in oval (ift88tz288/tz288) and lok (ccdc40 to237b/to237b) mutants. All embryos derived from a heterozygous ift88tz288/+ or ccdc40to237b/+ incross displayed similar amounts of expression of foxj1a (A and B, E and F) and charon (C and D, G and H). Genotyping confirmed that wild-type embryos and homozygous mutants were all present in the clutch. (I-P) Transcript levels of foxj1a and charon are inhibited in homozygous ntlab195/b195 (ntla- /-) mutants. Approximately 25% of embryos derived from an ntlab195/+ incross lacked foxj1a expression (J) and charon expression (N). Genotyping confirmed them as ntla-/- mutants. sox17 was expressed in all progenies of ntlab195/+ incross (L). Moreover, all embryos from ntlab195/+ incross displayed charon expression after injection of foxj1a mRNA (2 ng) (O). Genotyping indicated that homozygous mutants were present in the clutch. ift88tz288/+ and ntlab195/+ fish were obtained from the Zebrafish International Resource Center, and ccdc40to237b/+ fish were provided by the Mayo Clinic Translational Polycystic Kidney Disease Center. Genotyping of ift88tz288/tz288, ccdc40to237b/to237b, ntlab195/b195 embryos was performed as previously described (Huang and Schier, 2009; Becker-Heck et al., 2011). Shown are dorsal views of embryos at 75% epiboly (K and L), 95% epiboly (A, B, E, F, I, and J), and tailbud region at 10 to 12 somites (C, D, G, H, and M-P).