
|
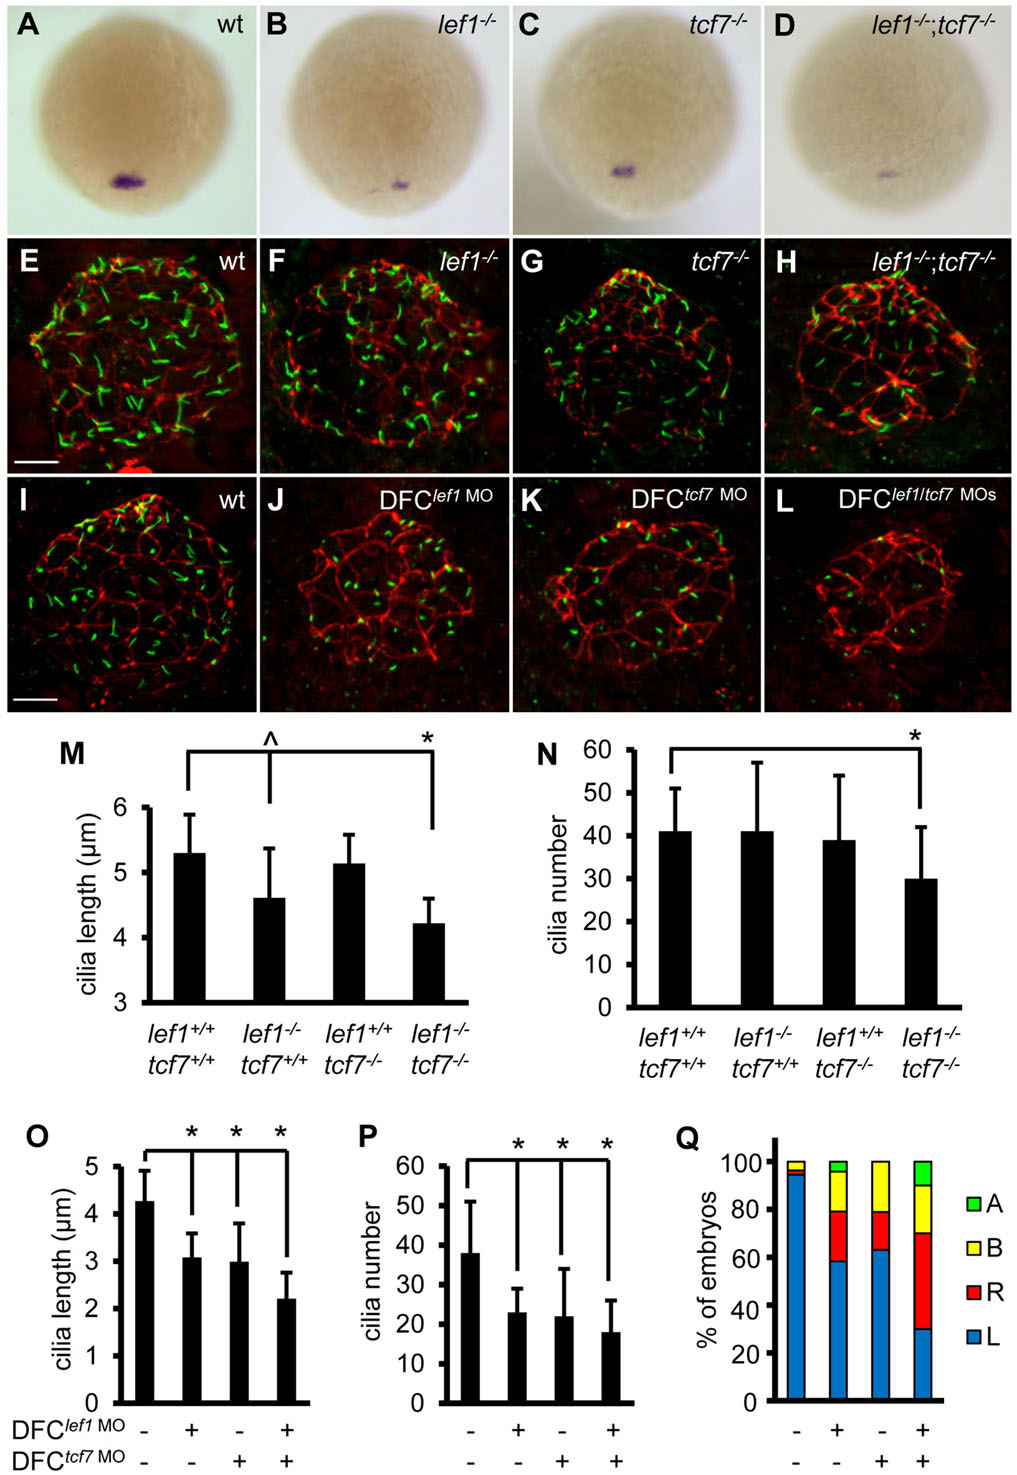
Fig. 3
Lef1 and Tcf7 cooperatively regulate foxj1a expression and ciliogenesis. (A-D) Disruption of Lef1 or Tcf7 downregulates foxj1a expression in DFCs. foxj1a transcript levels were reduced in homozygous lef1 (lef1-/-) (B) or tcf7 (tcf7-/-) embryos (C) compared with wild-type siblings (A), and further decreased or abolished in double homozygous (lef1-/-;tcf7-/-) mutants (D). Shown are dorsal views of 95% epiboly staged embryos. Genotyping was performed on embryos that had been analyzed by in situ hybridization. (E-H) Disruption of Lef1 and Tcf7 affects ciliogenesis in KV. Embryos were fixed at the 12-somite stage, and the head regions were collected for genotyping. Then, immunostaining was performed on wild-type siblings and homozygous mutants. KV cilia were visualized by anti-acetylated α-tubulin staining (green) and apical-basal polarity of KV cells by anti-ZO-1 staining (red). (I-L) DFC-specific depletion of Lef1 or Tcf7 results in shorter and fewer cilia. lef1 MO (2ng) and/or tcf7 MO (2ng) were injected into the yolk cells at the 256-cell stage, and embryos were collected at the 10-somite stage for immunostaining. (M-P) Quantification of cilia length and number in mutants (M,N; 11–32 embryos were scored for each genotype) and morphants (O, P; 11–31 embryos were analyzed for each group). Data are represented as mean±s.d. (Q) DFC-specific depletion of Lef1 or Tcf7 randomizes left-sided spaw expression. Percentage of embryos with specific patterns of spaw expression was scored at the 21-somite stage. wt, wild type; A, absence; B, bilateral; L, left side; R, right side. ^P<0.05, * P<0.01 compared with controls. Scale bars: 20µm in E-L.