
- Title
-
Neurovascular development in the embryonic zebrafish hindbrain
- Authors
- Ulrich, F., Ma, L.H., Baker, R.G., and Torres-Vazquez, J.
- Source
- Full text @ Dev. Biol.
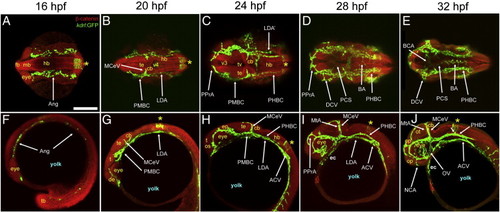
Overview of vascular development in the head and brain (16–32 hpf). A-J, Maximum intensity confocal projections of immuno-fluorescently stained embryos carrying the endothelial reporter Tg(kdrl:GFP)1a116. Endothelium, green (GFP). Cell outlines, red (β-catenin). Ages (hpf) indicated on top. Abbreviations (see Table 1):vasculature, white (apostrophe, right side). Neuroepithelium, yellow. Other structures, blue. Small white arrows, CtAs. Yellow asterisk, r5 GFP-positive neuroepithelial signal from the Tg(kdrl:GFP)1a116 reporter. A-E, Dorsal views (ventral level). Anterior, left. Left side, bottom. F-J, Left lateral views. Anterior, left. Dorsal, up. Scale bar (A), 200 μm. EXPRESSION / LABELING:
|
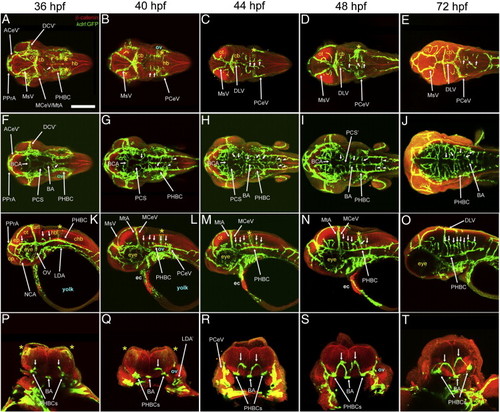
Overview of vascular development in the head and brain (36–72 hpf). A-T, Maximum intensity confocal projections of immuno-fluorescently stained embryos carrying the endothelial reporter Tg(kdrl:GFP)1a116. Endothelium, green (GFP). Cell outlines, red (β-catenin). Ages (hpf) indicated on top. Abbreviations (see Table 1): vasculature, white (with apostrophe, right side). Neuroepithelium, yellow. Other structures, blue. Small white arrows, CtAs. White arrowheads in (G-I) PHBC-BA connections. Yellow asterisk, r5 GFP-positive neuroepithelial signal from the Tg(kdrl:GFP)1a116 reporter. A-J, Dorsal views. Age-matched images from the same embryo collected at dorsal (A-E) and ventral (F-J) levels. Anterior, left. Left side, bottom. K-O, Left lateral views. Anterior, left. Dorsal, up. P-T, Transverse cross-sections of the posterior hindbrain at approximately the r5-r6 level. Dorsal, up. Left side, left. Scale bar (A): 200 μm for A-O and 100 μm for (P-T). EXPRESSION / LABELING:
|
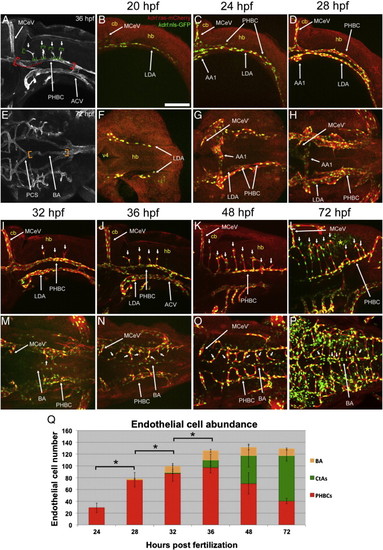
Endothelial cell abundance in the hindbrain vasculature (PHBC and its derivatives) increases and then stabilizes during development. A-P, Maximum intensity confocal projections of immuno-fluorescently stained embryos carrying the endothelial reporters Tg(kdrl:ras-mCherry)s896 and Tg(kdrl:nls-GFP). Endothelium, red. Endothelial cell nuclei, green. Ages (hpf) indicated above (except for A and E, where they are inside each picture at the top right corner). Abbreviations (see Table 1): vasculature, white; neuroepithelium, yellow. Small white arrows, CtAs. A-D, I-L, Left lateral views. Anterior, left. Dorsal, up. E-H, M-P, Dorsal views. Anterior, left. Left side, bottom. A, E, Diagrams showing the vascular regions where endothelial cell abundance was scored: PHBCs (delimited by the red brackets and dotted line, only the left one is shown in (A)), BA (orange brackets) and CtAs (green brackets). L,P, Neuroepithelial expression of the Tg(kdrl:nls-GFP) reporter after 48 hpf (yellow asterisk). These cells were not scored. Scale bar (B), 100 μm. Q, Bar graph showing endothelial cell abundance at 24–72 hpf in the PHBCs (red), BA (yellow) and CtAs (green). Consecutive stages with statistically significant differences (p < 0.05) in total endothelial cell abundance are indicated with a bracket and an asterisk. EXPRESSION / LABELING:
|
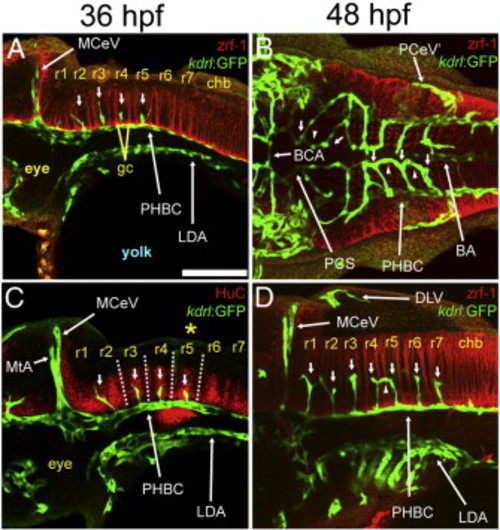
. Relationship between the CtAs and rhombomeres. A-D, Maximum intensity confocal projections of immuno-fluorescently stained embryos carrying the endothelial reporter Tg(kdrl:GFP)1a116. Endothelium, green (GFP). Rhombomere boundaries in A, B, D; red (zrf-1). Differentiated neurons in C; red (HuC). Ages (hpf) indicated above. Abbreviations (see Table 1): vasculature, white (apostrophe, right side); neuroepithelium, yellow. Small white arrows, CtAs. Small white arrowheads, ipsilateral CtA fusions. Yellow asterisk, r5 GFP-positive neuroepithelial signal from the Tg(kdrl:GFP)1a116 reporter. A, C, D, lateral views. Anterior, left. Dorsal, top. B, Dorsal view. Anterior, left. Left side, bottom. Scale bar (A), 100 μm. |
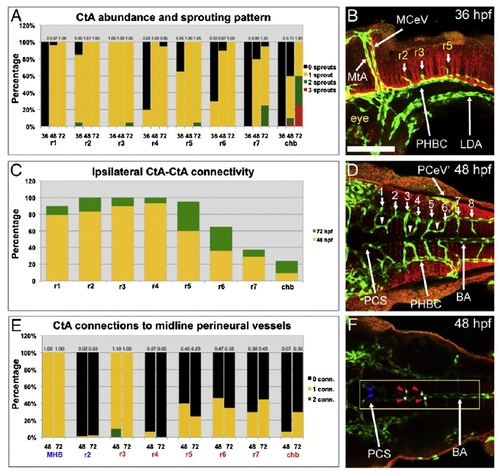
Quantification of CtA sprout abundance and connectivity in the 36–72 hpf hindbrain. A, Bar graph showing the percentage of rhombomere (r1 to r7) and caudal hindbrain (chb) sides with the specified number of ventrally invading CtA sprouts at 36, 48 and 72 hpf: zero (black), one (yellow), two (green) and three (red). The average number of CtAs found on each side of these hindbrain locales is indicated above each bar. See Tables S2 and S3 for corresponding average numbers, standard deviations and p-values. C, Bar graph showing the percentage of ipsilateral connectivity between CtA sprouts that invade each hindbrain locale ventrally (r1-chb) at 48 (yellow bars) and 72 hpf (green bars). See Tables S4 and S5 for the corresponding average numbers, standard deviations and p-values. See Table S6 to view the percentage of connectivity between all possible ipsilateral CtA sprout pairs. E, Bar graph showing the percentage of PCS and BAs with the indicated number of CtA connections at different anterior–posterior levels (MHB and r2 for the PCS; r3-chb for the BA). Bar color-coding: black (zero), yellow (one) and green (two) connections. The average number of CtA connections per locale and stage is indicated above each bar. See Tables S7 and S8 for the corresponding standard deviations and p-values. B, D, F, Maximum intensity confocal projections of immuno-fluorescently stained embryos carrying the endothelial reporter Tg(kdrl:GFP)1a116. Endothelium, green (GFP). Rhombomere boundaries, red (zrf-1 in B, acetylated Tubulin in D,F). Ages (hpf) indicated inside each picture at the top right corner. Abbreviations (see Table 1): vasculature, white (apostrophe, right side); neuroepithelium, yellow. Small white arrows, CtAs. Small white arrowheads, ipsilateral CtA fusions. B, Left lateral view. Anterior, left. Dorsal, up. D, F, Dorsal views. Anterior, left. Left side, bottom. For clarity only the ventral-most confocal stacks are shown in (F). CtA connections to the PCS (blue arrowheads) and BA (red arrowheads) are false-colored in white (yellow box). Scale bar (B), 100 μm.Quantification of CtA sprout abundance and connectivity in the 36–72 hpf hindbrain. A, Bar graph showing the percentage of rhombomere (r1 to r7) and caudal hindbrain (chb) sides with the specified number of ventrally invading CtA sprouts at 36, 48 and 72 hpf: zero (black), one (yellow), two (green) and three (red). The average number of CtAs found on each side of these hindbrain locales is indicated above each bar. See Tables S2 and S3 for corresponding average numbers, standard deviations and p-values. C, Bar graph showing the percentage of ipsilateral connectivity between CtA sprouts that invade each hindbrain locale ventrally (r1-chb) at 48 (yellow bars) and 72 hpf (green bars). See Tables S4 and S5 for the corresponding average numbers, standard deviations and p-values. See Table S6 to view the percentage of connectivity between all possible ipsilateral CtA sprout pairs. E, Bar graph showing the percentage of PCS and BAs with the indicated number of CtA connections at different anterior–posterior levels (MHB and r2 for the PCS; r3-chb for the BA). Bar color-coding: black (zero), yellow (one) and green (two) connections. The average number of CtA connections per locale and stage is indicated above each bar. See Tables S7 and S8 for the corresponding standard deviations and p-values. B, D, F, Maximum intensity confocal projections of immuno-fluorescently stained embryos carrying the endothelial reporter Tg(kdrl:GFP)1a116. Endothelium, green (GFP). Rhombomere boundaries, red (zrf-1 in B, acetylated Tubulin in D,F). Ages (hpf) indicated inside each picture at the top right corner. Abbreviations (see Table 1): vasculature, white (apostrophe, right side); neuroepithelium, yellow. Small white arrows, CtAs. Small white arrowheads, ipsilateral CtA fusions. B, Left lateral view. Anterior, left. Dorsal, up. D, F, Dorsal views. Anterior, left. Left side, bottom. For clarity only the ventral-most confocal stacks are shown in (F). CtA connections to the PCS (blue arrowheads) and BA (red arrowheads) are false-colored in white (yellow box). Scale bar (B), 100 μm. |
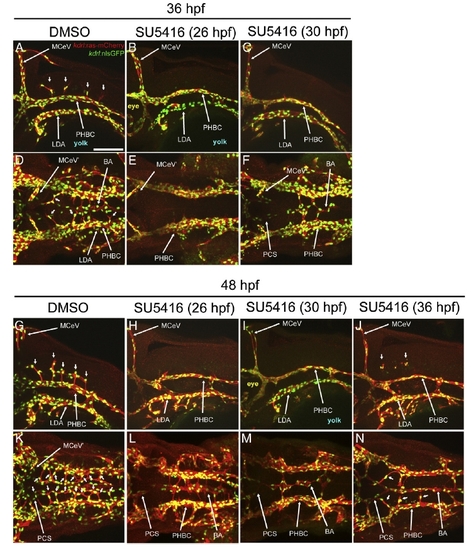
SU5416 treatments reveal stage-specific VEGF signaling requirements for BA and CtA development. A-N, Maximum intensity confocal projections of immuno-fluorescently stained embryos carrying the endothelial reporters Tg(kdrl:ras-mCherry)s896 and Tg(kdrl:nls-GFP). Endothelium, red. Endothelial cell nuclei, green. Images show 36 (A-F) and 48 hpf (G-N) embryos treated with 0.01% of the drug vehicle DMSO (control) or with 1 μMof the VEGF signaling inhibitor SU5416 (in 0.01% DMSO) at the ages indicated in parentheses (26, 30 or 36 hpf). Abbreviations (see Table 1): vasculature, white (apostrophe, right side). Small white arrows, CtAs. A-C, G-J, Left lateral views. Anterior, left. Dorsal, up. D-F, K-N, Dorsal views. Anterior, left. Left side, bottom. Scale bar (A), 100 μm. |
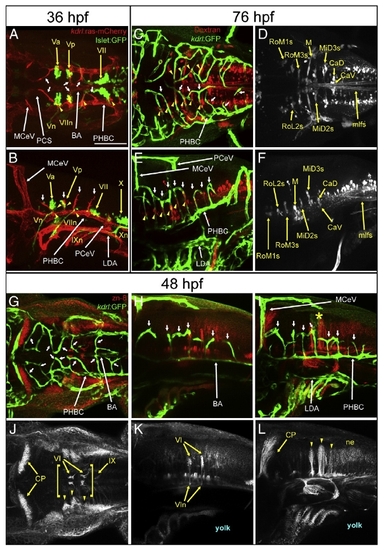
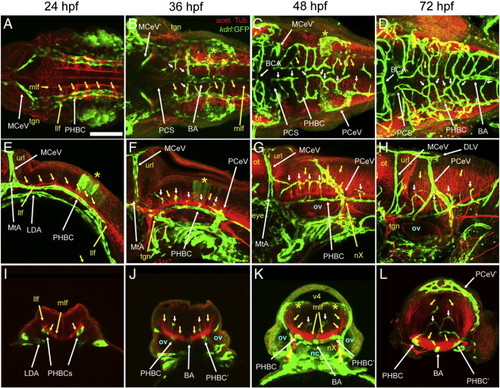
Anatomical relationship between hindbrain CtAs with branchiomotor neurons (BMNs), reticulospinal neurons (RSNs) and zn-8 positive neurons and axons. A-B, Maximum intensity confocal projections of immuno-fluorescently stained 36 hpf Tg(kdrl:ras-mCherry)s896; Tg(Islet1:GFP) embryos. Endothelium, red (mCherry). BMNs and their efferents, green (GFP). A, Dorsal view (ventral level). Anterior, left. Left side, bottom. B, Left lateral view. Anterior, left. Dorsal, up. C-F, Maximum intensity confocal projections of immunofluorescently stained 76 hpf embryos carrying the endothelial-specific reporter Tg(kdrl:GFP)1a116. RSNs retrogradely labeled with fluorescent Dextran. Endothelium, green (GFP). RSNs, red (C,E) or white (D,F). Abbreviations (see Table 1): vasculature, white. Neurons, yellow. Yellow arrowheads indicate regions where CtAs and RSNs are in close proximity to each other (C,E). C,D, Dorsal views. Anterior, left. Left side, bottom. E,F, Left lateral views. Anterior, left. Dorsal, up. G-L, Maximum intensity confocal projections of immunofluorescently stained 48 hpf embryos carrying the endothelial reporter Tg(kdrl:GFP)1a116. Endothelium, green (GFP). zn-8 positive (DM-GRASP/Neurolin) neurons and axons, red (G-I) or white (J-L). G,J, dorsal views. Anterior, left. Left side, bottom. H-I,K-L, left lateral views. Anterior, left. Dorsal, top. Abbreviations (see Table 1): vasculature, white; nuclei, nerves and commissures, yellow. Small white arrows, CtAs. Yellow arrowheads, regions where CtAs are in close proximity to nuclei or corresponding axons/neurites or prominent clusters of neurons in the neuroectoderm′s dorso-lateral region. Yellow brackets in (J), ventral axonal commissures. Yellow asterisk, r5 GFP-positive neuroepithelial signal from the Tg(kdrl:GFP)1a116 reporter. In (J-L), the abducens (VI) and glosso-pharyngeal (IX) motor neurons, the abducens nerves (VIn, arrows point to their hindbrain exit points) and the cerebellar plate (CP) are labeled. Scale bar (A), 100 μm. EXPRESSION / LABELING:
|
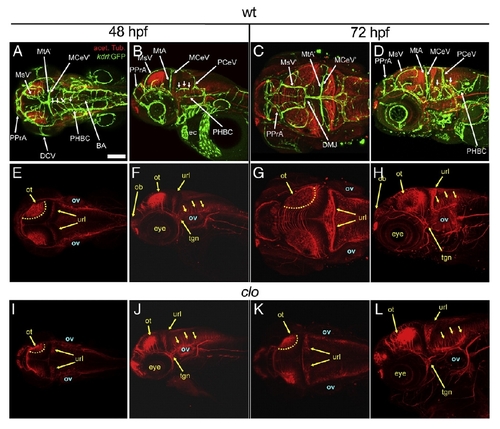
The axonal scaffolds develop largely independently of the vasculature. A-L, Maximum intensity confocal projections of immuno-fluorescently stained embryos carrying the endothelial-specific reporter Tg(kdrl:GFP)1a116. Endothelium, green (GFP). Axonal tracks, red (acetylated tubulin). Ages (hpf) indicated above. A-H, wild type (wt). I-L, clo (only the red channel is shown for simplicity). Abbreviations (see Table 1): vasculature, white (apostrophe, right side); axonal scafolds, yellow. Small white arrows, CtAs. Yellow dotted lines (E, I, G, K), dorsal limit of the optic tectum. Small yellow arrows, neurons with axonal commissures. A, E, I, C, G, K, Dorsal views. Anterior, left. Left side, bottom. B, F, J, D, H, L, Left lateral views. Anterior, left. Dorsal, top. Scale bar (A), 200 μm. EXPRESSION / LABELING:
PHENOTYPE:
|
Visualization of proliferating cells in the hindbrain and its vasculature. A-L, Maximum intensity confocal projections of immuno-fluorescently stained embryos carrying the endothelial reporters Tg(kdrl:ras-mCherry)s896 and Tg(kdrl:nls-GFP). Endothelium, red (mCherry). Endothelial cell nuclei, green (GFP). Mitotic cells, blue (phospho-Histone 3). Ages (hpf) indicated above. Abbreviations (see Table 1): vasculature, white (apostrophe, right side); neuroepithelium, yellow. Small white arrows, CtAs. A-F, Left lateral views. Anterior, left. Dorsal, up. G-L, Dorsal views. Anterior, left. Left side, bottom. Scale bar (A), 100 μm. Neuroepithelial expression of the Tg(kdrl:nls-GFP) reporter is indicated with the yellow asterisk. |
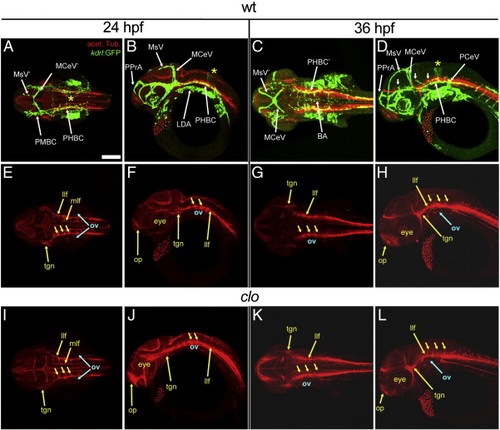
Head vasculature and axonal scaffold in wild type and clo at 24 and 36 hpf. A-L, Maximum intensity confocal projections of immuno-fluorescently stained embryos carrying the endothelial reporter Tg(kdrl:GFP)1a116. Endothelium, green (GFP). Axonal tracks (acetylated tubulin). Ages (hpf) indicated above. A-H, wild type (wt). I-L, clo (only the red channel is shown for simplicity). Abbreviations (see Table 1): vasculature, white (apostrophe, right side); axonal scafolds, yellow. Small white arrows, CtAs. Yellow asterisk, r5 GFP-positive neuroepithelial signal from the Tg(kdrl:GFP)1a116 reporter. A, E, I, C, G, K, Dorsal views. Anterior, left. Left side, bottom. B, F, J, D, H, L, Left lateral views. Anterior, left. Dorsal, top. Scale bar (A), 200 μm. |
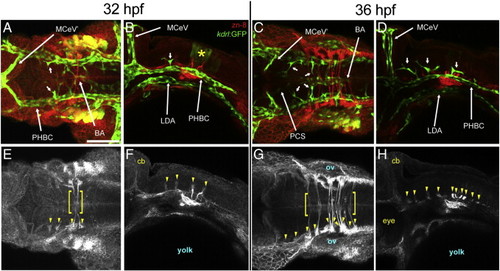
Relationship between the hindbrain CtAs and zn-8 positive neurons and axons at 32 and 36 hpf. A-H, Maximum intensity confocal projections of immuno-fluorescently stained embryos carrying the endothelial reporter Tg(kdrl:GFP)1a116. Endothelium, green (GFP). zn-8 positive (DM-GRASP/Neurolin) neurons and axons, red (A-D) or white (E-H). Ages (hpf) indicated above. A, C, E, G, dorsal views. Anterior, left. Left side, bottom. B, F, D, H, left lateral views. Anterior, left. Dorsal, top. Abbreviations (see Table 1): vasculature, white (apostrophe, right side); neurons and commissures, yellow. Small white arrows, CtAs. Small yellow arrowheads, prominent clusters of neurons in the neuroectoderm′s dorso-lateral region. Yellow brackets, ventral axonal commissures. Yellow asterisk, r5 GFP-positive neuroepithelial signal from the Tg(kdrl:GFP)1a116 reporter. Scale bar (A), 100 μm. |
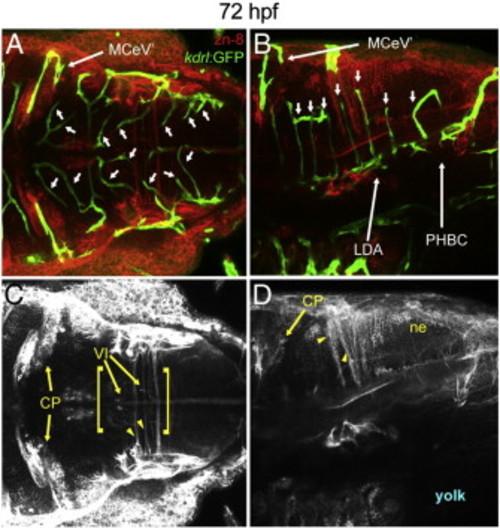
Relationship between the hindbrain CtAs and zn-8 positive neurons and axons at 72 hpf. A-D, Maximum intensity confocal projections of immuno-fluorescently stained embryos carrying the endothelial reporter Tg(kdrl:GFP)1a116. Endothelium, green (GFP). zn-8 positive (DM-GRASP/Neurolin) neurons and axons, red (A,B) or white (C,D). A,C, dorsal views. Anterior, left. Left side, bottom. B,D, left lateral views. Anterior, left. Dorsal, top. Abbreviations (see Table 1): vasculature, white; neurons and commissures, yellow. Small white arrows, CtAs. Small yellow arrowheads, prominent clusters of neurons in the neuroectoderm′s dorso-lateral region. Yellow brackets, ventral axonal commissures. Yellow asterisk, r5 GFP-positive neuroepithelial signal from the Tg(kdrl:GFP)1a116 reporter. The abducens (VI) motor neurons, the abducens nerves (VIn) and the cerebellar plate (CP) are labeled. Scale bar (A), 100 μm. |
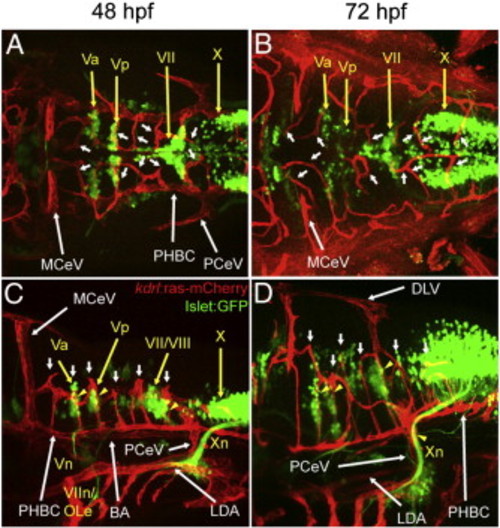
Anatomical relationship between the hindbrain CtAs and branchiomotor neurons (BMNs) and their efferents. A-D, Maximum intensity confocal projections of immuno-fluorescently stained Tg(kdrl:ras-mCherry)s896; Tg(Islet1:GFP) embryos. Endothelium, red (mCherry). BMNs and their efferents, green (GFP). Ages (hpf) indicated on top. Abbreviations (see Table 1): vasculature, white; BMN nuclei and nerves, yellow. Small white arrows, CtAs. Yellow arrowheads, regions where CtAs are in close proximity to BMNs or their efferents. A-B, Dorsal views (ventral level). Anterior, left. Left side, bottom. C-D, Left lateral views. Anterior, left. Dorsal, up. Scale bar (A), 100 μm. |
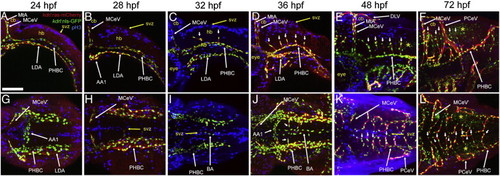
Anatomical relationship between hindbrain vessels and the axonal scaffold. A-L, Maximum intensity confocal projections of immuno-fluorescently stained embryos carrying the endothelial-specific reporter Tg(kdrl:GFP)1a116. Endothelium, green (GFP). Axonal tracks, red (acetylated Tubulin). Ages (hpf) indicated above each column. Abbreviations (see Table 1): vasculature, white (apostrophe, right side); neuroepithelium, yellow. Small white arrows, CtAs. Small yellow arrows, neurons with axonal commissures. Yellow asterisk, r5 GFP-positive neuroepithelial signal from the Tg(kdrl:GFP)1a116 reporter. A-D, Dorsal views. Anterior, left. Left side, bottom. E-H, Left lateral views. Anterior, left. Dorsal, top. I-L, Transverse cross-sections of the hindbrain at the r5-r6 level. Dorsal, up. Left side, left. Scale bar (A), 100 μm. |
Reprinted from Developmental Biology, 357(1), Ulrich, F., Ma, L.H., Baker, R.G., and Torres-Vazquez, J., Neurovascular development in the embryonic zebrafish hindbrain, 134-51, Copyright (2011) with permission from Elsevier. Full text @ Dev. Biol.