
|
Fig. S5
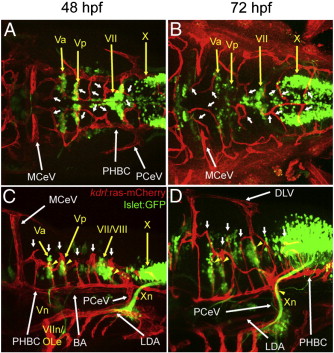
Anatomical relationship between the hindbrain CtAs and branchiomotor neurons (BMNs) and their efferents. A-D, Maximum intensity confocal projections of immuno-fluorescently stained Tg(kdrl:ras-mCherry)s896; Tg(Islet1:GFP) embryos. Endothelium, red (mCherry). BMNs and their efferents, green (GFP). Ages (hpf) indicated on top. Abbreviations (see Table 1): vasculature, white; BMN nuclei and nerves, yellow. Small white arrows, CtAs. Yellow arrowheads, regions where CtAs are in close proximity to BMNs or their efferents. A-B, Dorsal views (ventral level). Anterior, left. Left side, bottom. C-D, Left lateral views. Anterior, left. Dorsal, up. Scale bar (A), 100 μm.
Reprinted from Developmental Biology, 357(1), Ulrich, F., Ma, L.H., Baker, R.G., and Torres-Vazquez, J., Neurovascular development in the embryonic zebrafish hindbrain, 134-51, Copyright (2011) with permission from Elsevier. Full text @ Dev. Biol.