
Fig. 5
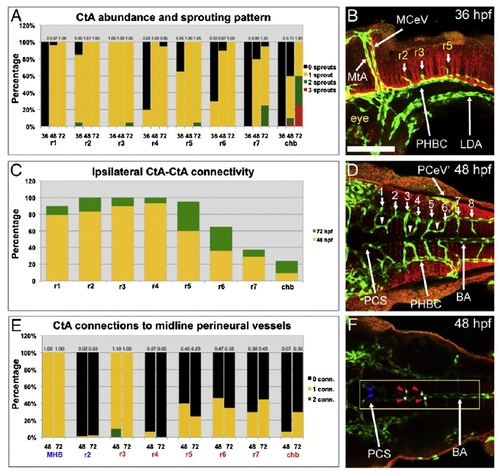
Quantification of CtA sprout abundance and connectivity in the 36–72 hpf hindbrain. A, Bar graph showing the percentage of rhombomere (r1 to r7) and caudal hindbrain (chb) sides with the specified number of ventrally invading CtA sprouts at 36, 48 and 72 hpf: zero (black), one (yellow), two (green) and three (red). The average number of CtAs found on each side of these hindbrain locales is indicated above each bar. See Tables S2 and S3 for corresponding average numbers, standard deviations and p-values. C, Bar graph showing the percentage of ipsilateral connectivity between CtA sprouts that invade each hindbrain locale ventrally (r1-chb) at 48 (yellow bars) and 72 hpf (green bars). See Tables S4 and S5 for the corresponding average numbers, standard deviations and p-values. See Table S6 to view the percentage of connectivity between all possible ipsilateral CtA sprout pairs. E, Bar graph showing the percentage of PCS and BAs with the indicated number of CtA connections at different anterior–posterior levels (MHB and r2 for the PCS; r3-chb for the BA). Bar color-coding: black (zero), yellow (one) and green (two) connections. The average number of CtA connections per locale and stage is indicated above each bar. See Tables S7 and S8 for the corresponding standard deviations and p-values. B, D, F, Maximum intensity confocal projections of immuno-fluorescently stained embryos carrying the endothelial reporter Tg(kdrl:GFP)1a116. Endothelium, green (GFP). Rhombomere boundaries, red (zrf-1 in B, acetylated Tubulin in D,F). Ages (hpf) indicated inside each picture at the top right corner. Abbreviations (see Table 1): vasculature, white (apostrophe, right side); neuroepithelium, yellow. Small white arrows, CtAs. Small white arrowheads, ipsilateral CtA fusions. B, Left lateral view. Anterior, left. Dorsal, up. D, F, Dorsal views. Anterior, left. Left side, bottom. For clarity only the ventral-most confocal stacks are shown in (F). CtA connections to the PCS (blue arrowheads) and BA (red arrowheads) are false-colored in white (yellow box). Scale bar (B), 100 μm.Quantification of CtA sprout abundance and connectivity in the 36–72 hpf hindbrain. A, Bar graph showing the percentage of rhombomere (r1 to r7) and caudal hindbrain (chb) sides with the specified number of ventrally invading CtA sprouts at 36, 48 and 72 hpf: zero (black), one (yellow), two (green) and three (red). The average number of CtAs found on each side of these hindbrain locales is indicated above each bar. See Tables S2 and S3 for corresponding average numbers, standard deviations and p-values. C, Bar graph showing the percentage of ipsilateral connectivity between CtA sprouts that invade each hindbrain locale ventrally (r1-chb) at 48 (yellow bars) and 72 hpf (green bars). See Tables S4 and S5 for the corresponding average numbers, standard deviations and p-values. See Table S6 to view the percentage of connectivity between all possible ipsilateral CtA sprout pairs. E, Bar graph showing the percentage of PCS and BAs with the indicated number of CtA connections at different anterior–posterior levels (MHB and r2 for the PCS; r3-chb for the BA). Bar color-coding: black (zero), yellow (one) and green (two) connections. The average number of CtA connections per locale and stage is indicated above each bar. See Tables S7 and S8 for the corresponding standard deviations and p-values. B, D, F, Maximum intensity confocal projections of immuno-fluorescently stained embryos carrying the endothelial reporter Tg(kdrl:GFP)1a116. Endothelium, green (GFP). Rhombomere boundaries, red (zrf-1 in B, acetylated Tubulin in D,F). Ages (hpf) indicated inside each picture at the top right corner. Abbreviations (see Table 1): vasculature, white (apostrophe, right side); neuroepithelium, yellow. Small white arrows, CtAs. Small white arrowheads, ipsilateral CtA fusions. B, Left lateral view. Anterior, left. Dorsal, up. D, F, Dorsal views. Anterior, left. Left side, bottom. For clarity only the ventral-most confocal stacks are shown in (F). CtA connections to the PCS (blue arrowheads) and BA (red arrowheads) are false-colored in white (yellow box). Scale bar (B), 100 μm. |
| Gene: | |
|---|---|
| Antibody: | |
| Fish: | |
| Anatomical Terms: | |
| Stage Range: | Prim-25 to Long-pec |
Reprinted from Developmental Biology, 357(1), Ulrich, F., Ma, L.H., Baker, R.G., and Torres-Vazquez, J., Neurovascular development in the embryonic zebrafish hindbrain, 134-51, Copyright (2011) with permission from Elsevier. Full text @ Dev. Biol.