
|
Fig. S1
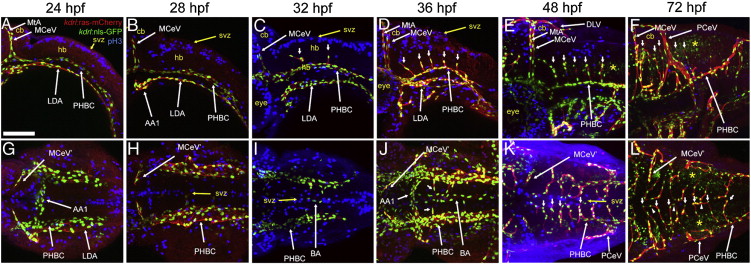
Visualization of proliferating cells in the hindbrain and its vasculature. A-L, Maximum intensity confocal projections of immuno-fluorescently stained embryos carrying the endothelial reporters Tg(kdrl:ras-mCherry)s896 and Tg(kdrl:nls-GFP). Endothelium, red (mCherry). Endothelial cell nuclei, green (GFP). Mitotic cells, blue (phospho-Histone 3). Ages (hpf) indicated above. Abbreviations (see Table 1): vasculature, white (apostrophe, right side); neuroepithelium, yellow. Small white arrows, CtAs. A-F, Left lateral views. Anterior, left. Dorsal, up. G-L, Dorsal views. Anterior, left. Left side, bottom. Scale bar (A), 100 μm. Neuroepithelial expression of the Tg(kdrl:nls-GFP) reporter is indicated with the yellow asterisk.
Reprinted from Developmental Biology, 357(1), Ulrich, F., Ma, L.H., Baker, R.G., and Torres-Vazquez, J., Neurovascular development in the embryonic zebrafish hindbrain, 134-51, Copyright (2011) with permission from Elsevier. Full text @ Dev. Biol.