
- Title
-
Cellular mechanisms of posterior neural tube morphogenesis in the zebrafish
- Authors
- Harrington, M.J., Chalasani, K., and Brewster, R.
- Source
- Full text @ Dev. Dyn.
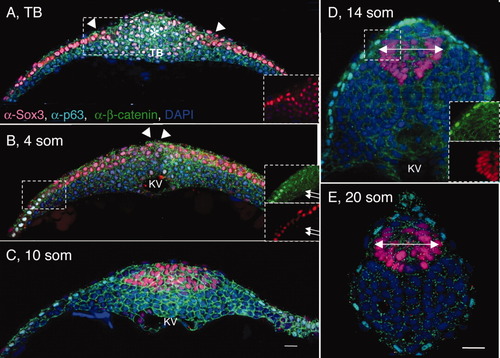
Shaping of the posterior neural tube (PNT). A-E: Transverse sections through the tailbud region (at the level of Kupffer′s vesicle [KV]) of wild-type (WT) tailbud (TB) (A), 4 somites (som; B), 10 som (C), 14 som (D), and 20 som (E) embryos, labeled with α-Sox3C (neural tissue, pink), α-p63 (epidermis, nuclear labeling, turquoise), α-β-catenin (cell surface marker, green), and DAPI (4′,6-diamidine-2-phenylidole-dihydrochloride; nucleus, blue). Dorsal side is up in these and all subsequent images of transverse sections. Insets in (B,D) show separated channels in boxed areas; in insets p63-positive cells are labeled in green and Sox3C-positive cells are in red. The asterisk in A indicates the region of the tailbud expressing low levels of Sox3C. White arrowheads point to the medial edge of the neural domain. B: White arrows in insets point to cells coexpressing Sox3C and p63. Double arrows in (D,E) indicate the width of the neural tube. KV, Kupffer′s vesicle; som, somites; TB, tailbud. Scale bar = 20 μm. |
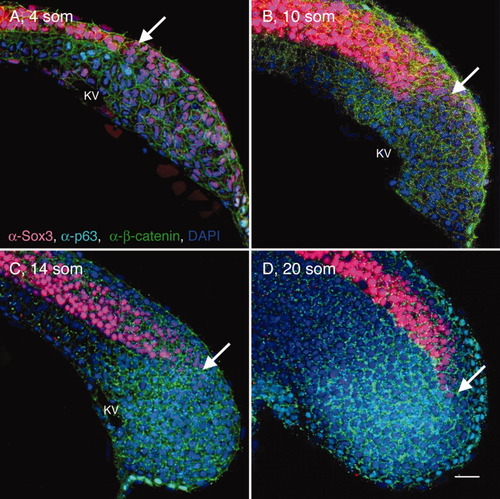
Elongation of the posterior neural tube (PNT). A-D: Sagittal sections through the tailbud (at the level of KV) of wild-type (WT) 4 som (A), 10 som (B), 14 som (C), and 20 som (D) embryos, labeled with α-Sox3C (neural tissue, pink), α-p63 (epidermis, nuclear labeling, turquoise), α-β-catenin (cell membrane labeling, green), and DAPI (4′,6-diamidine-2-phenylidole-dihydrochloride, nucleus, blue). Anterior is to the left and dorsal side is up in these and all subsequent images of sagittal sections. White arrows indicate the caudal-most extent of the Sox3C high-expression domain. KV, Kupffer′s vesicle; som, somites. Scale bar = 20 μm. |
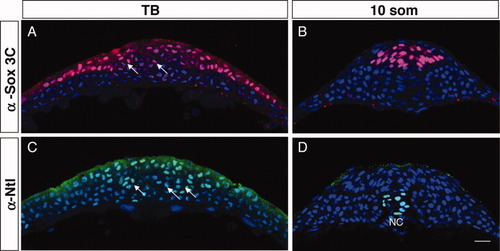
The tailbud is organized in tissue-restricted domains. A-D: Transverse sections of wild-type (WT) tailbud (TB) (A,C) and 10 somites (som; B,D) embryos labeled with α-Sox3C (neural tissue, pink; A,B), α-Ntl (axial mesoderm precursors, green; C,D) and DAPI (4′,6-diamidine-2-phenylidole-dihydrochloride; nuclear marker, blue). Arrows point to clusters of cells that express either low levels of Sox3C (A) or that are Ntl-positive (B). NC, notochord. Scale bar = 20 μm. |
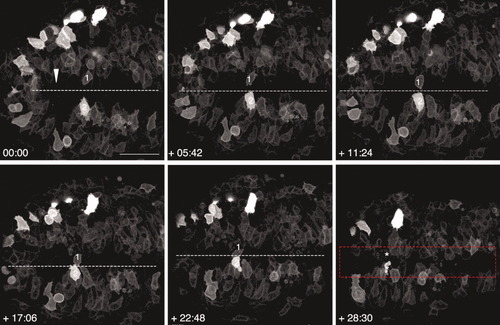
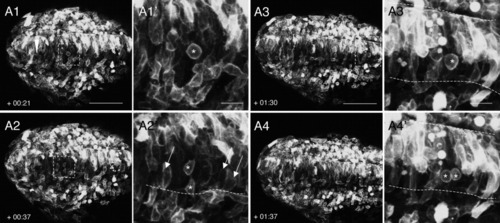
Cell behaviors at the posterior midline. Still frames from a time-lapse movie of a wild-type (WT) embryo viewed from the dorsal side and labeled with membrane-targeted enhanced GFP (mGFP). Anterior is to the right in all panels. Numbers in the lower left corner indicate time elapsed (min) after the beginning of the movie. The embryo was approximately 4 somites (som) at time 0. The arrowhead indicates the position of Kupffer′s vesicle at the beginning of the movie. Numbers 1 and 2 identify the same cells in different frames. Asterisks show positions of cells 1 and 2 that have disappeared out of the field of view. Dotted lines represent the midline. The red rectangular shape delineates the region on either side of the midline, approximately 40 μm wide, where infolding takes place. Scale bar = 50 μm. |
Cell behaviors driving the late stages of neural convergence in posterior regions. A1-A4: Still frames from a time-lapse movie of a wild-type (WT) embryo, oriented dorsal side up and labeled with membrane-targeted enhanced GFP (mGFP). A1′-A4′: Higher magnification images of boxed areas in (A1-A4). Anterior is to the right in all panels. The embryo was approximately 10 somites (som) at time 0. Approximately 290 μm (beginning of movie) to 370 μm (end of movie) anterior to KV (red arrowhead in panel A1) was imaged. This represents the distance between KV and the posterior-most somites, as the full extent of the tailbud region anterior to KV measures approximately 140 μm at 12-13 som. Dotted lines represent the basal surface of the neuroepithelium. Numbers in the lower left corner indicate time elapsed (hours:minutes) after the beginning of the movie. The arrows in A2′ indicate cells with an elongated shape that are in close contact with the basal lamina. Asterisks indicate dividing cells. Scale bars = 100 μm in A1-A4; 20 μm in A1′-A4′. |
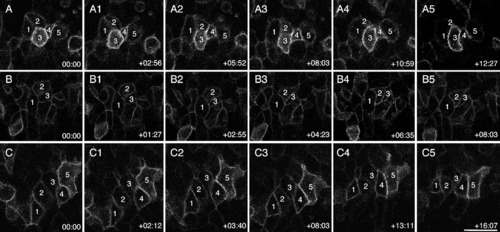
Cell behaviors driving the early stages of neural convergence in posterior regions. Still frames from a time-lapse movie of a wild-type (WT) embryo, viewed from the dorsal side and labeled with membrane-targeted enhanced GFP (mGFP). Anterior is to the right in all panels. A-C: The midline is toward the bottom in series A and B; and toward the top in series C. Panel series A, B, and C illustrate clusters of cells whose behaviors were tracked over time. The embryo was approximately 4 somites (som) at time 0. Time elapsed (hr:min) from the beginning of the movie is indicated in the lower right corner. Scale bar = 20 μm. |
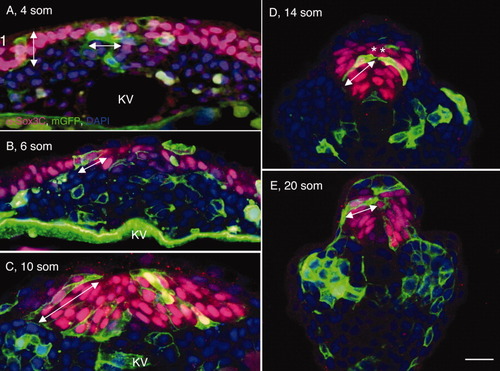
Angular orientation and length-to-width ratios (LWRs) of posterior neural tube (PNT) cells. A-E: Transverse sections through the tailbud of wild-type (WT) embryos at 4 somites (som; A), 6 som (B), 10 som, (C), 14 som (D), and 20 som (E), labeled with membrane-targeted enhanced GFP (mGFP; cell surface marker, green), α-Sox3C (neural tissue, pink) and DAPI (4′,6-diamidine-2-phenylidole-dihydrochloride; nuclear marker, blue). Double arrowheads indicate the angular orientation and length of cells. Asterisks in (D) show cells that are likely to derive from a common mother cell. KV, Kupffer′s vesicle. Scale bar = 20 μm. |
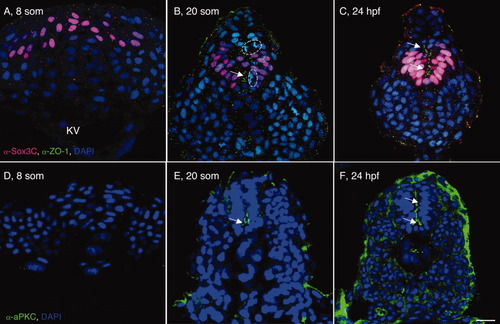
Posterior neural cells undergo progressive epithelialization. A-F: Transverse sections through the tailbud of wild-type (WT) 8 somites (som; A,D), 20 som (B,E), and 24 hours postfertilization (hpf; C,F) embryos labeled with α-Sox3C (A-C, neural tissue, pink), α-ZO-1 (A-C, apical membrane, green), α-aPKC (D-F, apical membrane, green) and DAPI (4′,6-diamidine-2-phenylidole-dihydrochloride; nuclear marker, blue). Arrows point to apical ZO-1 and aPKC localization. Dotted circles surround cells dividing along the mediolateral axis. KV, Kupffer′s vesicle; som, somite; hpf, hr postfertilization. Scale bar = 20 μm. |
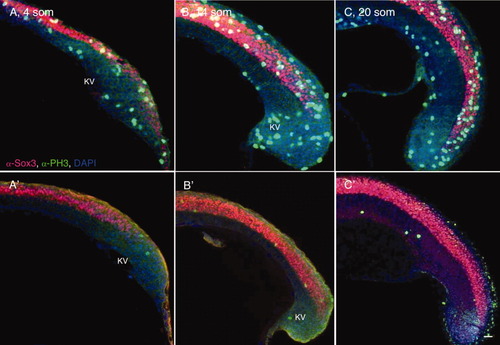
Inhibition of cell proliferation has little effect on spinal cord elongation. A-C′: Sagittal sections through the tailbud of control (A-C) and drug-treated (A′-C′) 4 somites (som; A,A′), 14 som (B,B′), and 20 som (C,C′) embryos, labeled with α-Sox3C (neural tissue, pink), α-PH3 (mitotic, nuclear marker, green), α-β-catenin (cell surface marker, green), and DAPI (4′,6-diamidine-2-phenylidole-dihydrochloride; nuclear marker, blue). KV, Kupffer′s vesicle; som, somites. Scale bar = 20 μm. |
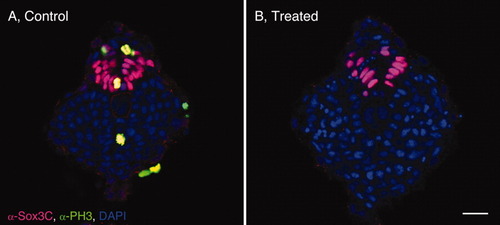
Posterior neural tube (PNT) size is normal in drug-treated embryos. A,B: Transverse sections through the tailbud of control (A) and hydroxyurea/aphidicolin-treated (B) embryos labeled with α-Sox3C, α-PH3 and DAPI (4′,6-diamidine-2-phenylidole-dihydrochloride). |
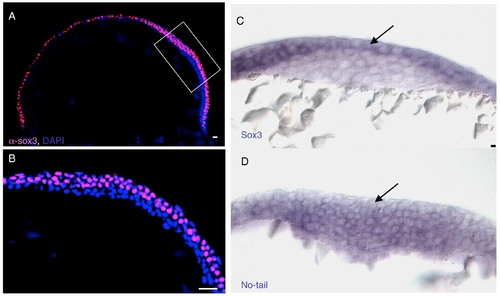
Early Sox3C expression and complementary expression of sox3c and ntl mRNA in the tail bud. A: Sagital view of a 70% epiboly embryo labeled with α-Sox3C (epiblast, pink) and DAPI (4′,6-diamidine-2-phenylidole-dihydrochloride; nuclei, blue). B: Higher magnification of boxed area in (A). C,D: Cross-sections through the tail bud region of TB-1 somites (som) embryos labeled by in situ hybridization with sox3c (C) and ntl (D) riboprobes. The arrows in C and D highlight the complementary expression patterns of sox3c and ntl. Scale bar = 20 μm. |