
|
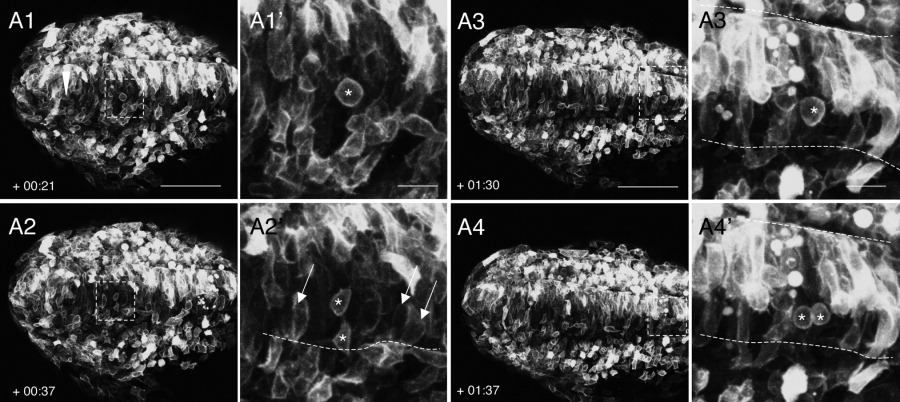
Fig. 5 Cell behaviors driving the late stages of neural convergence in posterior regions. A1-A4: Still frames from a time-lapse movie of a wild-type (WT) embryo, oriented dorsal side up and labeled with membrane-targeted enhanced GFP (mGFP). A1′-A4′: Higher magnification images of boxed areas in (A1-A4). Anterior is to the right in all panels. The embryo was approximately 10 somites (som) at time 0. Approximately 290 μm (beginning of movie) to 370 μm (end of movie) anterior to KV (red arrowhead in panel A1) was imaged. This represents the distance between KV and the posterior-most somites, as the full extent of the tailbud region anterior to KV measures approximately 140 μm at 12-13 som. Dotted lines represent the basal surface of the neuroepithelium. Numbers in the lower left corner indicate time elapsed (hours:minutes) after the beginning of the movie. The arrows in A2′ indicate cells with an elongated shape that are in close contact with the basal lamina. Asterisks indicate dividing cells. Scale bars = 100 μm in A1-A4; 20 μm in A1′-A4′.