
Fig. 4
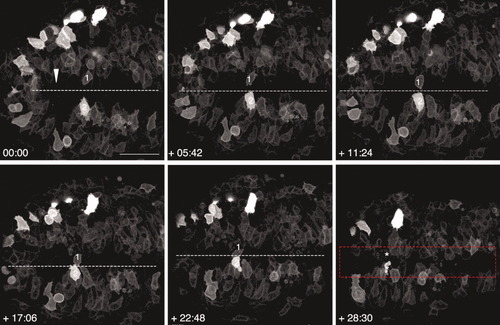
Cell behaviors at the posterior midline. Still frames from a time-lapse movie of a wild-type (WT) embryo viewed from the dorsal side and labeled with membrane-targeted enhanced GFP (mGFP). Anterior is to the right in all panels. Numbers in the lower left corner indicate time elapsed (min) after the beginning of the movie. The embryo was approximately 4 somites (som) at time 0. The arrowhead indicates the position of Kupffer′s vesicle at the beginning of the movie. Numbers 1 and 2 identify the same cells in different frames. Asterisks show positions of cells 1 and 2 that have disappeared out of the field of view. Dotted lines represent the midline. The red rectangular shape delineates the region on either side of the midline, approximately 40 μm wide, where infolding takes place. Scale bar = 50 μm. |