
- Title
-
Redundant activities of Tfap2a and Tfap2c are required for neural crest induction and development of other non-neural ectoderm derivatives in zebrafish embryos
- Authors
- Li, W., and Cornell, R.A.
- Source
- Full text @ Dev. Biol.
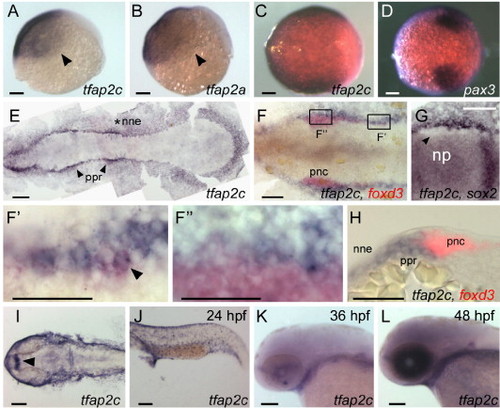
Comparison of tfap2a and tfap2c expression at embryonic stages. (A, B) Lateral views, animal pole oriented up and dorsal side to the right, of panel A, tfap2c and panel B, tfap2a expression in ventral and lateral ectoderm at 6 hpf. Arrowheads point to the limit of expression, which is similar or identical for the genes. (C, D) Animal pole views of panel C, tfap2c and panel D, pax3 expression at 8.5 hpf. Expression of pax3 marks prospective neural crest (Lewis et al., 2004); tfap2c expression partially or entirely overlaps it. (E–G) Dorsal views of flat-mounted embryos at 11 hpf, anterior to the left. (E) tfap2c expression is detected in non-neural ectoderm (nne, asterisk), with increased levels immediately adjacent to the rostral neural plate, in the pre-placodal region (ppr, arrowheads). (F) Double RNA in situ hybridization with foxd3 (red) and tfap2c (blue) probes. More caudal cells expressing foxd3, which are recently specified pre-migratory neural crest cells (pnc), also express tfap2c (shown at higher magnification in panel F′, arrowhead indicates double-labeled cell). By contrast, at more rostral levels, tfap2c is expressed in ppr but is excluded from the majority of foxd3 expressing cells (shown at higher magnification in panel F″). (G) An embryo labeled with tfap2c and sox2, a pan-neural plate marker (Okuda et al., 2006). tfap2c expression is absent from cells immediately lateral to the neural plate, which is the pnc domain (arrowhead). (H) A transverse section of an embryo labeled as in panel F. tfap2c (blue) is expressed at high level in the ppr and nne, lateral to foxd3 expression (red) in pnc. (I–L) Dorsal and lateral views of embryos at the indicated ages processed to reveal tfap2c. (I) In the head, and panel J, trunk at 24 hpf, expression of tfap2c is detected in surface ectoderm and diencephalon (arrowhead). (K) At 36 hpf, tfap2c expression is reduced in surface ectoderm; (L) at 48 hpf, high level tfap2c expression is detected in the eye. Scale bars: (A–G, I–L), 100 μm; (F′–H), 50 μm. |
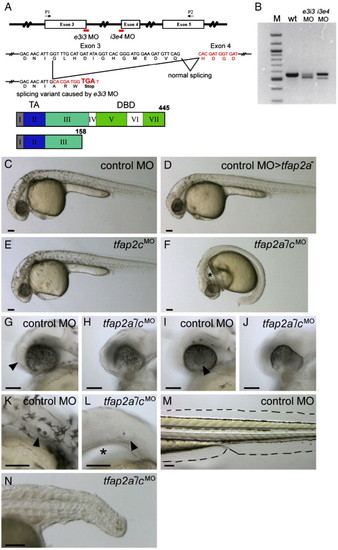
tfap2a mutant embryos injected with tfap2c morpholino (MO) display abnormal development in ectoderm-derived tissues. (A) Top, schematic of the tfap2c gene showing the position of MOs used in this study; middle, effects of the tfap2c e3i3 MO on the tfap2c transcript; bottom, the Tfap2c protein. Roman numerals refer to exons, numbers refer to amino acids. TA, transactivation domain. DBD, DNA binding domain. e3i3 MO targeting the exon 3 splice donor site and i3e4 MO targeting the exon 4 splicing acceptor site are shown in red. P1 and P2 are the primers used for the RT-PCR shown in panel B. tfap2c e3i3 MO causes a deletion of 38 nucleotides, which leads to a frame shift and introduces a stop codon at the end of exon 3. (B) tfap2c RT-PCR results. Amplification of cDNA from uninjected wild-type embryos (wt) with the primers P1 and P2 shown in panel A yielded a single band of the expected size of 557 bp, while amplification of 24 hpf cDNA from tfap2c e3i3 MO injected embryos (e3i3 MO) yielded a smaller band of 519 bp. Amplification of cDNA from tfap2c i3e4 MO injected embryos (i3e4 MO) also yielded a smaller band. M, 100 bp ladder. (C–F) Lateral views of live embryos at 28 hpf. In panel C, a wild-type embryo injected with standard control MO (hereafter, control embryo) with normal morphology and pigmentation. In panel D, a control MO-injected tfap2a homozygous mutant embryo displaying normal morphology but reduced number of melanophores. In panel E, a wild-type embryo injected with tfap2c e3i3 MO with normal morphology and pigmentation. (F) A tfap2a homozygous mutant embryo injected with tfap2c e3i3 MO (hereafter, tfap2a-/cMO embryo), with no visible pigmentation, an absence of yolk extension, a poorly extended tail, and edema ventral to the hindbrain (asterisk). (G–L) Lateral views of the embryos shown in panels C and F at higher magnification. Olfactory placode (arrowhead in panel G) and lens (arrowhead in panel I) are visible in the control embryo but not in the tfap2a-/cMO embryo (H, J) which also displays malformation of the ventral retina. Otic vesicle in panel K, the control embryo, contains two otoliths (arrowhead). While in panel L, the tfap2a-/cMO embryo, it is reduced in size and contains a single otolith (arrowhead). An enlarged view of the edema ventral to the hindbrain is also seen (asterisk). (M, N) Lateral views of the same embryos shown in panels C and F at 72 hpf. Medial fin folds, as outlined in panel M, the control embryo, are virtually absent in panel N, the tfap2a-/cMO embryo. Notochord and somites also appear abnormal, presumably due to indirect effects, because tfap2a and tfap2c expression are not detected in these tissues. Scale bars: 100 μm. PHENOTYPE:
|
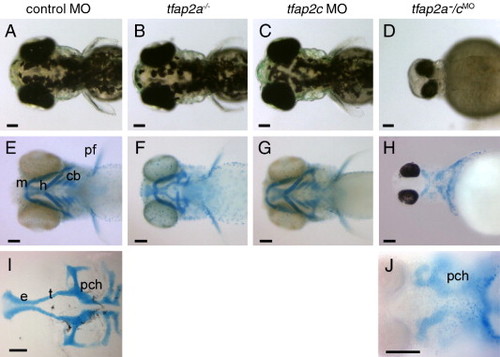
tfap2a/c deficient embryos display non-additive defects in pigmentation and jaw morphology. (A–D) Dorsal views of live 72 hpf embryos. (A) Melanophores are abundant on the dorsal aspect of the head in a control-MO injected wild-type embryo, slightly reduced in panel B, a control MO-injected tfap2a mutant, normal in panel C, a tfap2c MO-injected wild-type embryo, but absent from panel D, a tfap2a-/cMO embryo (6 of 6 tfap2a-/cMO embryos). (E–H) Ventral views of 4 dpf embryos processed to reveal cartilage (alcian green), and bleached to remove pigment (except panel H). (E) Cartilages derived from mandibular (1st arch, m), hyoid (2nd arch, h), and ceratobranchial (3rd–7th arches, cb) arches are seen in a control embryo. Pectoral fin (pf) is also visible. (F) A control MO-injected tfap2a homozygous mutant embryo, with normal sized mandibular, but severely reduced hyoid and ceratobranchial cartilages, as previously reported (Schilling et al., 1996). (G) A tfap2c MO-injected wild-type embryo, in which all craniofacial cartilages appear normal. (H) A tfap2a-/cMO embryo, in which ventral craniofacial cartilage elements and pectoral fin are absent (10 of 10 tfap2a-/cMO embryos). (I) Ventral view of dissected neurocranium from a control embryo. (J) Ventral view of a tfap2a-/cMO embryo, shown at higher magnification, only the mesoderm-derived posterior neurocranium is visible (10 of 10 tfap2a-/cMO embryos). e, ethmoid plate; pch, parachordal; t, trabeculae cranii (Schilling et al., 1996). Scale bars: 100 μm. PHENOTYPE:
|
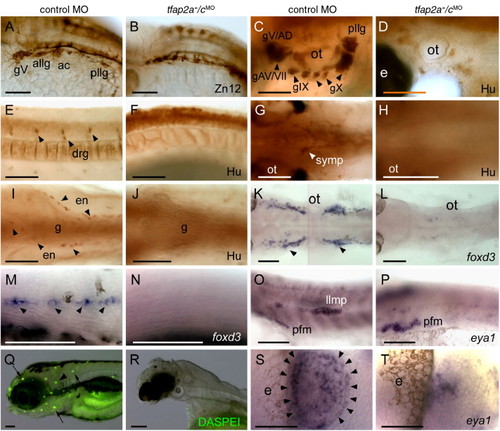
Neural crest and placode derivatives are absent or reduced in tfap2a/c deficient embryos. (A, B) Lateral views of 28 hpf embryos processed for anti-HNK1 (Zn12 antibody) immunoreactivity (IR), revealing the presence of cranial ganglia neurons in panel A, a control MO-injected wild-type embryo, and their absence in panel B, a tfap2a-/cMO embryo (9 of 10 tfap2a-/cMO embryos). (C–F) Lateral and (G–J) ventral views of 72 hpf embryos processed for anti-Hu IR. (C, E, G, I) In control embryos anti-Hu IR reveals panel C, cranial ganglia surrounding the otic vesicle (ot), (E), dorsal root ganglia (drg) in the trunk, (G), sympathetic neurons at vagal level, and (I), proximal enteric neurons, adjacent to gut (g), also at vagal level. (D, F, H, J) All of these neurons appear to be absent from a tfap2a-/cMO embryo (8 of 8 tfap2a-/cMO embryos). (K, L) Dorsal and (M, N) lateral views of 28 hpf embryos processed to reveal foxd3 expression, which labels (K) satellite cells (arrowheads) and (M) Schwann cells associated with lateral line processes (arrowheads) in a control embryo, but not in panels L, N, a tfap2a-/cMO embryo (12 of 12 tfap2a-/cMO embryos). (O, P) Lateral views of 28 hpf embryos processed to reveal eya1 expression, which is detected in the lateral line migrating primordium (llmp) in panel O, a control embryo, but absent in panel P, a tfap2a-/cMO embryo (11 of 11 tfap2a-/cMO MO embryos). eya1 expression in presumed pectoral fin mesoderm (pfm) remains normal in the tfap2a-/cMO MO embryo (11 of 11 tfap2a-/cMO MO embryos). (Q, R) Lateral head views of 4 dpf embryos incubated in DASPEI, which is taken up by hair cells. In panel Q, a control embryo, DASPEI-positive hair cells in the inner ear (arrowhead) and the neuromasts (arrows) are visible. In panel R, a tfap2a-/cMO embryo, DASPEI positive cells are not seen. (S, T) Dorsal anterior views of 28 hpf embryos processed to reveal eya1 expression. eya1 expression in olfactory placode is apparent in panel S, a control embryo. In panel R, a tfap2a-/cMO embryo, a small cluster of eya1-expressing cells is present in this position (11 of 11 tfap2a-/cMO embryos). gV, trigeminal ganglion; allg, anterior lateral line ganglion; ac, acoustic ganglion; pllg, posterior lateral line ganglion; gAD, anterodorsal lateral line ganglion; gAV, anteroventral lateral line ganglion; gVII, facial sensory ganglion; gIX, glossopharyngeal ganglion; gX, vagus ganglion; e, eye; ot, otic vesicle. Scale bars: (A–R), 100 μm; (S, T), 50 μm. |
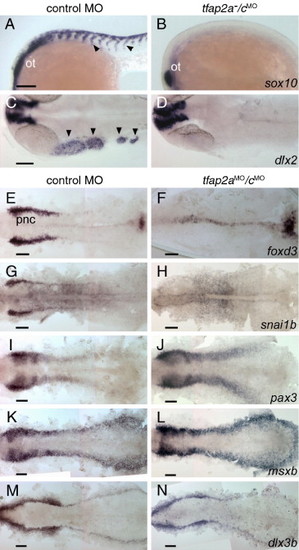
Gene expression characteristic of neural crest is absent, but of the neural plate border and pre-placodal region is present in tfap2a/c deficient embryos. (A, B) Lateral views of 22 hpf embryos processed to reveal sox10 expression, which is present in migratory neural crest streams (arrowheads) and the otic vesicle (ot) in panel A, a control embryo; in panel B, a tfap2a-/cMO embryo, it is only present in the ot (11 of 11 tfap2a-/cMO embryos). (C, D) Dorsal views of 24 hpf embryos processed to reveal dlx2 expression, which is present in cranial migratory neural crest streams (arrowheads) and brain in panel C, a control embryo, but only in the latter in panel D, a tfap2a/c deficient embryo (10 of 10 tfap2a-/cMO embryos). (E–N) Dorsal views of flat-mounted, 11 hpf embryos processed to reveal the indicated markers. foxd3 and snai1b expression that are characteristic of premigratory neural crest (pnc) cells are absent in embryos injected with tfap2a e2i2 MO and tfap2c e3i3 MO (hereafter, tfap2aMO/cMO embryo) (foxd3, 27 of 27 tfap2aMO/c MO embryos; snai1b, 29 of 29 tfap2aMO/cMO embryos. Also not shown, at the same stage, sox10, 29 of 29 tfap2aMO/cMO embryos). Expression of pax3, msxb and dlx3b expression appear normal in tfap2aMO/cMO embryos (100%, n is greater or equal to 30 tfap2aMO/cMO embryos for each gene, also not shown, zic2b). Scale bars: 100 μm. EXPRESSION / LABELING:
|
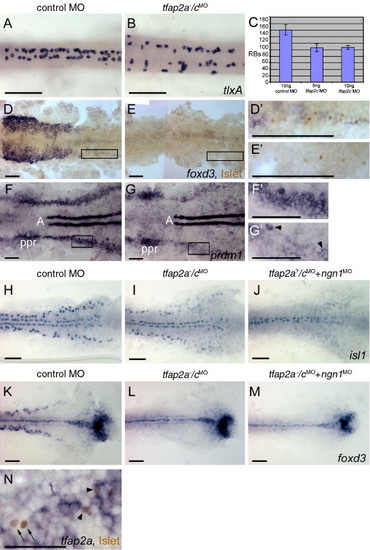
Rohon–Beard sensory neurons (RBs) are reduced but not absent in tfap2a/c deficient embryos. (A, B) Dorsal trunk views of 20 hpf embryos processed to reveal tlxA expression, anterior to the left. RBs are abundant in panel A, a wild-type or tfap2a mutant embryo, but moderately reduced in panel B, a tfap2a-/cMO embryo. Note that RBs are abnormally distributed in the latter, suggestive of abnormal patterning in the dorsal neural tube. (C) The average number of tlxA-positive cells in the dorsal spinal cord at 20 hpf. Error bars indicate standard deviation. Left column, embryos derived from tfap2a heterozygous mutants and injected with control MO, n = 23 embryos. Middle column, tfap2a mutants injected with 5 ng tfap2c e3i3 MO, n = 5 embryos. Right column, tfap2a mutants injected with 10 ng tfap2c e3i3 MO, n = 8 embryos. (D, E) Dorsal views of flat mounted 12 hpf embryos stained for anti-Islet immunoreactivity (brown, nuclear) and foxd3 mRNA (purple, cytoplasmic), anterior to the left. Premigratory neural crest (pnc) cells expressing foxd3 and RBs expressing anti-Islet IR are present in panel D, a control embryo. RBs and pnc cells are intermingled, as seen at higher magnification in panel D′ (corresponds to box in panel D). In panel E, a presumed tfap2a-/cMO embryo, foxd3 expression is absent while RBs are still present, as shown at higher magnification in panel E′ (11 of 40 injected embryos derived from tfap2a heterozygous mutants). (F, G) Dorsal views of flat mounted 11 hpf embryos processed to reveal prdm1 expression, anterior to the left. In panel F, a control embryo, prdm1 expression is detected in the pre-placodal region (ppr), in the neural plate boundary in the trunk (panel F′ corresponds to box in panel F), and in adaxial cells (A). (G) In a presumed tfap2a-/cMO embryo, prdm1 is expressed in scattered cells at the neural plate border (arrowheads) (panel G′ corresponds to box in panel G) (7 of 29 injected embryos derived from tfap2alow heterozygotes). (H–M) Dorsal trunk views of flat mounted 12.5 hpf embryos. isl1 (H) and foxd3 (K) expression shown in control embryos. (I) In the presumed tfap2a-/cMO embryos, isl1 expression is moderately reduced (16 of 56 injected embryos derived from tfap2alow heterozygotes), while foxd3 expression is absent (panel L, 12 of 58 injected embryos derived from tfap2alow heterozygotes). (J) In an embryo derived from tfap2a heterozygous mutant parents and co-injected with tfap2c e3i3 MO and ngn1 MO, isl1 expression in lateral neural plate, indicating RBs, is absent (48 of 51 tfap2c MO and ngn1 MO injected embryos). (M) In a presumed tfap2a mutant injected with tfap2c MO and ngn1 MO, foxd3 expression is absent (M, 16 of 53 injected embryos derived from tfap2alow heterozygotes). (N) Dorsal view of a 12.5 hpf embryo processed to reveal anti-Islet IR (brown, nuclear) and tfap2a mRNA (purple, cytoplasmic), anterior to the left. Some RBs that are positive for anti-Islet IR also express tfap2a (arrowheads). There are also RBs that are devoid of tfap2a expression in the cytoplasm (arrows). Scale bars: (A–M), 100 μm; (N), 50 μm. EXPRESSION / LABELING:
PHENOTYPE:
|
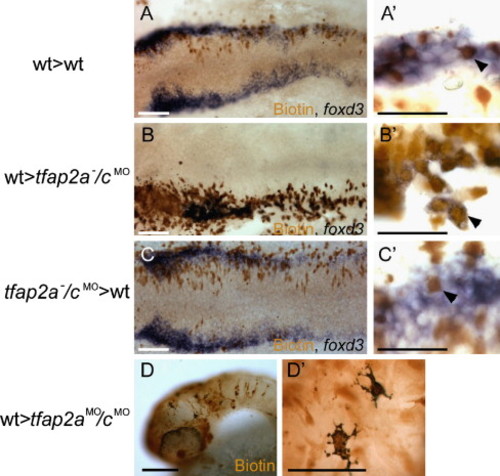
Chimera experiments suggest requirement for Tfap2a/c activity in neural crest induction is cell autonomous. (A–C) Dorsal views of flat mounted 12 hpf embryos. (A) A chimera derived from a wild-type host and a wild-type donor. Biotin-labeled, donor derived cells are seen to express foxd3 (arrowhead in panel A2) (a total of 40 biotin-labeled foxd3-expressing cells were found, 3 embryos scored). (B) A chimera derived from a tfap2a-/cMO host and a wild-type donor. Biotin-labeled, donor derived cells expressing foxd3 are visible (arrowhead in panel B′) (150 of 151 foxd3-expressing cells were biotin-labeled, 5 embryos scored). (C) A chimera derived from a wild-type host and a tfap2a-/cMO donor embryo. A biotin-labeled, foxd3 negative cell is seen interspersed with host cells expressing foxd3 (shown at higher magnification in panel C′, arrowhead) (of 95 biotin-labeled cells within the host foxd3 domain, none expressed foxd3, 6 embryos scored). (D) Lateral view of a 48 hpf a chimera derived from a tfap2aMO/cMO host and a wild-type donor. Melanophores are visible in the head. As seen at higher magnification in panel D′, melanophores are labeled with biotin, indicating that they are donor-derived (out of 30 such chimeras that survived to 48 hpf, 11 had at least 5 or more biotin-positive melanophores and lacked melanophores without biotin). Scale bars: (A--D), 100 μm; (A′--D′), 50 μm. |
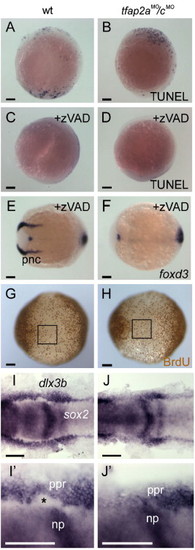
Loss of neural crest in tfap2a/c deficient embryos is concomitant with an expansion of neural plate. (A–D) Lateral views, dorsal to the right, of either uninjected wild-type or tfap2aMO/cMO embryos fixed at 11 hpf and processed to reveal dying cells with TUNEL. A wild-type embryo and a tfap2aMO/cMO embryo have comparable numbers of TUNEL-positive cells [control embryos, 62 ± 70 (average ± standard deviation), n = 13; tfap2aMO/cMO embryos, 42 ± 38, n = 28; unpaired t test, p = 0.23]. (C) A wild-type embryo, and (D) a tfap2aMO/cMO embryo, after treatment with caspase inhibitor zVAD-fmk. Reduced levels of cell death are seen in both of them (control embryos, 10 ± 14, n = 19, p < 0.005 in comparison to untreated controls; tfap2aMO/cMO embryos, 17 ± 13, n = 18, p < 0.05, in comparison to untreated tfap2aMO/cMO embryos). Dorsal views, anterior to the left, of panel E, a wild-type embryo, and panel F, a tfap2aMO/cMO embryo treated with zVAD-fmk and processed to reveal foxd3 expression at 11 hpf. foxd3 expression is absent in the premigratory neural crest (pnc) domain of the zVAD treated tfap2aMO/cMO embryo (30 of 30 zVAD treated tfap2aMO/cMO embryos). (G, H) Ventral views, anterior to the left, of embryos incubated in BrdU for 20 min at 10 hpf, fixed at 11 hpf, and stained for anti-BrdU IR. The number of anti-BrdU IR positive cells within a 200 x 200 μm region of ventral ectoderm (boxes in panels G and H) was comparable in both groups (control embryos, 37 ± 6 anti-BrdU IR positive cells, n = 9 embryos; tfap2aMO/cMO embryos, 35 ± 7 anti-BrdU IR positive cells, n = 9 embryos; unpaired t test, p = 0.48). (I, J) Dorsal views of 11 hpf embryos processed to reveal sox2 expression, labeling neural plate (np), and dlx3b expression, labeling the pre-placodal region (ppr). (I′, J′) Close-up views of right side of embryos shown in panels I and J, respectively. The space between these two expression domains, normally occupied by premigratory neural crest (asterisk in panel I2), is absent in the tfap2aMO/cMO embryo (J, 30 of 32 tfap2aMO/cMO embryos). Scale bars: (A–J), 100 μm; (I′, J′), 50 μm. EXPRESSION / LABELING:
|

Misexpression of Xenopus TFAP2A expands neural crest into the neural plates. (A, C, E, G, I) Uninjected control embryos or (B, D, F, H, J) embryos co-injected with RNA encoding β-galactosidase and GRXAP2, treated with dexamethasone at 8 hpf. (A–H) Embryos fixed at 11 hpf, and processed to reveal β-galactosidase activity (turquoise) (B, D, F, H) and expression of the indicated gene (dark blue). Expression of neural crest markers is seen to be expanded into the rostral domain of the neural plate on the injected side of the embryo (asterisk) (foxd3, 29 of 37 embryos; snai1b, 31 of 40 embryos; sox9b, 34 of 45 embryos) while expression of neural plate marker sox2 is decreased on the injected side (37 of 50 embryos). (I, J) Lateral views of live embryos at 36 hpf, showing a massive expansion of melanophores in the GRXAP2-injected embryo (27 of 34 RNA-injected embryos). Scale bars: 100 μm. |
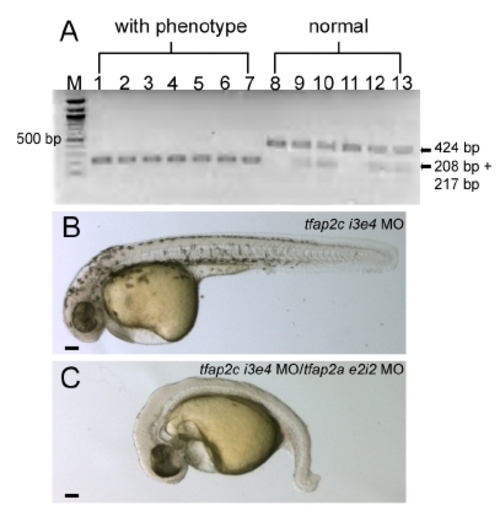
A PCR-based genotype assay of tfap2c MO-injected tfap2a mutant embryos. The low mutation introduces a Blp1 restriction site into exon 5 of tfap2a cDNA (Knight et al., 2003). tfap2c e3i3 MO was injected into 31 embryos derived from tfap2a heterozygous mutant parents. PCR on genomic DNA harvested from individual embryos revealed that all embryos with the strong phenotype harbored two copies of the Blp1-sensitive allele of tfap2a, while embryos with normal phenotype harbored 1 or 0 copies of this allele. All 31 embryos were assayed; this gel shows results from all 7 embryos with the strong phenotype (lanes 1–7) and 6 embryos with normal morphology. M, 100 bp ladder. (B, C) Lateral views of live embryos at 30 hpf. In B, a wild-type embryo injected with tfap2c i3e4 MO (hereafter, control embryo) with normal morphology and pigmentation. In C, a wild-type embryo injected with tfap2a e2i2 MO and tfap2c e3i3 MO, with no visible pigmentation, an absence of yolk extension, a poorly extended tail, and edema ventral to the hindbrain. EXPRESSION / LABELING:
PHENOTYPE:
|
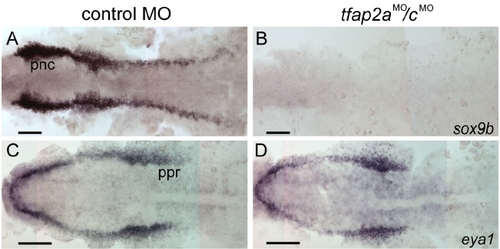
Gene expression characteristic of neural crest is absent, but of pre-placodal region is present in tfap2a/c deficient embryos. (A, B) Dorsal views of flat-mounted, 11 hpf embryos processed to reveal sox9b expression. sox9b expression that is characteristic of premigratory neural crest (pnc) cells is absent in the tfap2aMO/cMO embryos (31 of 31 tfap2aMO/cMO embryos). (C, D) Dorsal views of flat-mounted, 11 hpf embryos processed to reveal eya1 expression. Expression of eya1 in the preplacodal region (ppr) appears normal in the tfap2aMO/cMO embryos (40 of 40 tfap2aMO/cMO embryos). Scale bars: 100 μm. |
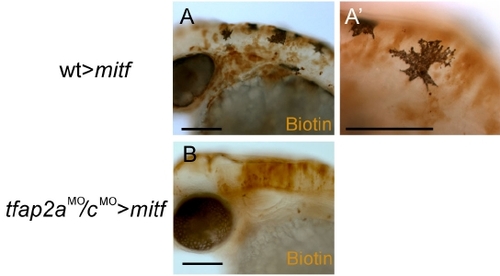
Cells from tfap2a/c deficient donors do not give rise to melanophores in mitf/nacre homozygous host embryos. (A) Lateral view of a 48 hpf chimera derived from a wild-type donor and a mitf/nacre homozygous host embryo nacre mutants have neural crest but lack melanophores because of a cell autonomous requirement for MITF in the melanophore lineage (Lister et al., 1999). (A′) A close-up view reveals that the melanophores found in the embryo contain biotin and thus are donor-derived (13 transplanted embryos, at least 5 donor-derived melanophores were found in each of them). (B) Lateral view of a 48 hpf chimera derived from a tfap2aMO/cMO donor and a mitf/nacre homozygous host embryo. Despite the presence of biotin-labeled donor-derived cells in the dorsal neural tube, no melanophores are visible in this embryo (0 melanophores were found in 18 transplanted embryos which had donor-derived cells in the dorsal neural tube). Scale bars: A, B, 100 μm; A′, 50 μm. |

Injection of RNA encoding full-length Tfap2a into tfap2a/c deficient embryos efficiently rescued foxd3 expression in premigratory neural crest (pnc). (A–C) Dorsal views of flat-mounted embryos at 11 hpf, anterior to the left. foxd3 is expressed in pnc cells in A, a uninjected wild-type embryo, and this expression is absent in B, a tfap2aMO/cMO embryo. (C) In tfap2aMO/cMO embryo also co-injected with tfap2a and lacZ mRNAs, foxd3 expression in pnc cells is visible on the injected side, marked by X-gal stain (light blue) (36 of 43 tfap2a mRNA injected tfap2aMO/cMO embryos). Scale bars: 100 μm. EXPRESSION / LABELING:
|
Reprinted from Developmental Biology, 304(1), Li, W., and Cornell, R.A., Redundant activities of Tfap2a and Tfap2c are required for neural crest induction and development of other non-neural ectoderm derivatives in zebrafish embryos, 338-354, Copyright (2007) with permission from Elsevier. Full text @ Dev. Biol.