
- Title
-
Loss of slc39a14 causes simultaneous manganese hypersensitivity and deficiency in zebrafish
- Authors
- Tuschl, K., White, R.J., Trivedi, C., Valdivia, L.E., Niklaus, S., Bianco, I.H., Dadswell, C., González-Méndez, R., Sealy, I.M., Neuhauss, S.C.F., Houart, C., Rihel, J., Wilson, S.W., Busch-Nentwich, E.M.
- Source
- Full text @ Dis. Model. Mech.
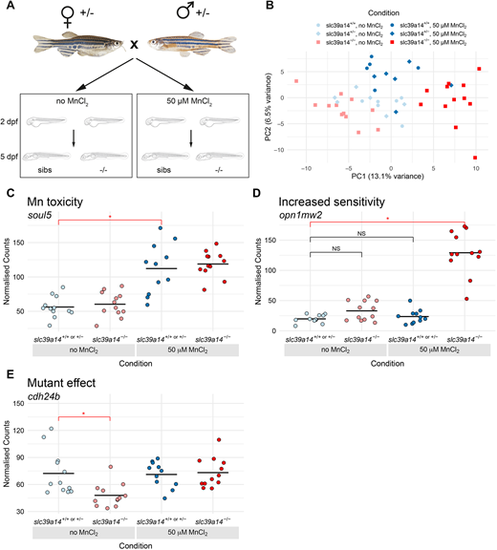
DeTCT analysis identifies three groups of differentially expressed genes. (A) Diagram of the experiment. Embryos from a slc39a14+/− incross were either left unexposed or exposed to 50 µM MnCl2 from 2 to 5 dpf. (B) Principal component analysis of the samples. Principal component (PC) 1 is plotted on the x-axis and PC2 on the y-axis. Samples belonging to the same condition are grouped together. Circles represent wild-type embryos, diamonds represent heterozygotes and squares represent homozygote mutants. Unexposed sibling embryos are indicated in light blue and MnCl2-exposed embryos are in dark blue. Unexposed mutants are coloured light red and exposed mutants are dark red. (C) Group 1 (Mn toxicity) genes were defined as those with a significant difference between exposed and unexposed siblings (red bar with asterisk). An example plot of normalised counts for the soul5 gene is shown. The colour scheme for C-E is the same as in B. (D) Group 2 (Increased sensitivity) genes were defined as those with a significant difference between exposed mutants and unexposed siblings (red bar with asterisk), but without significant differences between either unexposed mutants or exposed siblings when compared to unexposed siblings (black bars labelled NS, not significant). An example plot of normalised counts for the opn1mw2 gene is shown. (E) Group3 (Mutant effect) was defined as genes with a significant difference between unexposed mutants and unexposed siblings (red bar with asterisk). Example plot of normalised counts for the cdh24b gene. *P<0.05 determined using the Wald test (see Materials and Methods). |
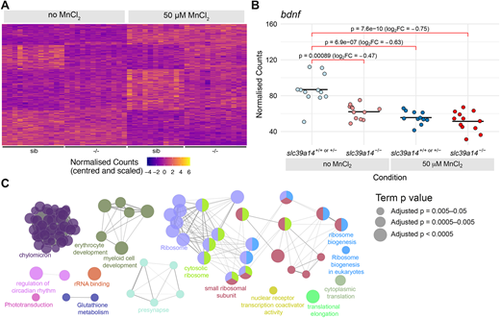
Manganese overexposure causes neurotoxicity and metabolic defects in slc39a14+/+ or slc39a14+/− embryos. (A) Heatmap of the expression of all 328 genes with a significant difference between exposed and unexposed siblings (Group 1 – Mn toxicity, Table S1). Each row represents a different gene and each column is a sample. Mutant embryos are displayed for completeness; however, the group of genes is defined by the response in siblings only. The normalised counts for each gene have been mean centred and scaled by dividing by the standard deviation. (B) Plot of the normalised counts for each sample of the gene bdnf in Group 1. Unexposed sibling embryos are indicated in light blue and MnCl2-exposed ones are in dark blue. Unexposed mutants are coloured light red and exposed mutants are dark red. FC, fold change. Wald test test was used to determine significance. (C) Enrichment of Gene Ontology (GO) terms associated with the genes in A. Diagram produced using the CytoScape ClueGO app. Nodes represent enriched GO terms and edges connect GO terms that have annotated genes in common. Different components of the network are coloured according to the categories labelled on the diagram. The sizes of the circles represent the adjusted P-values for each GO term as indicated on the right (Wald test). See Fig. S1 for GO enrichment split by up- and downregulation. |
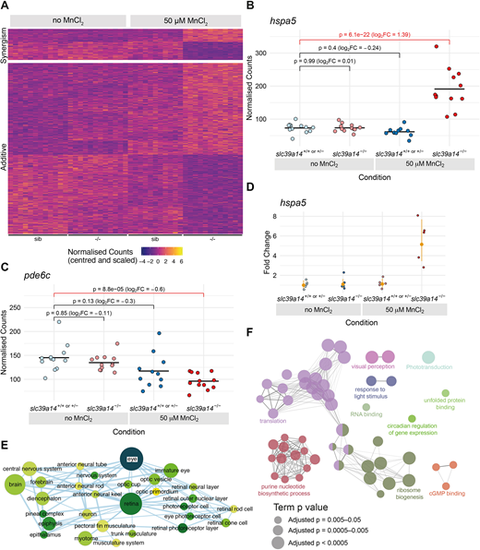
Effect of Mn treatment in slc39a14−/− mutants. (A) Heatmap of the expression of all 613 genes with a significant difference between exposed mutant and unexposed sibling embryos, but without without significant effects of treatment or genotype. The heatmaps are split into genes that show either synergistic or additive effects of the individual genotype and treatment effects. Each row represents a different gene and each column is a sample. The normalised counts for each gene have been mean centred and scaled by dividing by the standard deviation. (B) Example of a gene (hspa5) with a synergistic effect of treatment and genotype. The difference between the exposed mutants and unexposed siblings cannot be explained by adding together the separate effects of Mn treatment and the slc39a14−/− mutation. Unexposed sibling embryos are indicated in light blue and MnCl2-exposed embryos are in dark blue. Unexposed mutants are coloured light red and exposed mutants are dark red. (C) Example of a gene (pde6c) that has an additive effect of treatment and genotype. The difference between exposed mutants and unexposed siblings is consistent with adding together the two sub-threshold effects of treatment and genotype produce. Colour scheme is as in B. FC, fold change. Wald test was used to determine significance in B,C. (D) qRT-PCR showed comparable gene expression changes for hspa5 as for the single-embryo sequencing dataset. The individual samples are displayed as fold change relative to the mean value for unexposed siblings, and the mean and 95% confidence intervals for each condition indicated are in orange. Compare with B. (E) Enrichment Map network of the Zebrafish Anatomy Ontology (ZFA) enrichment results. Each node represents an enriched ZFA term and the edges join nodes that have overlapping genes annotated to them. The width of each edge is proportional to the amount of overlap; nodes are coloured by −log10[adjusted P-value] (Wald test); and the size represents the number of significant genes annotated to the term. (F) ClueGO network diagram of the enrichment of GO terms. Nodes represent enriched GO terms and edges connect nodes that share annotations to the significant genes. Different components of the network are coloured according to the categories as labelled on the diagram. The sizes of the circles represent the adjusted P-values for each GO term as indicated below (Wald test). |
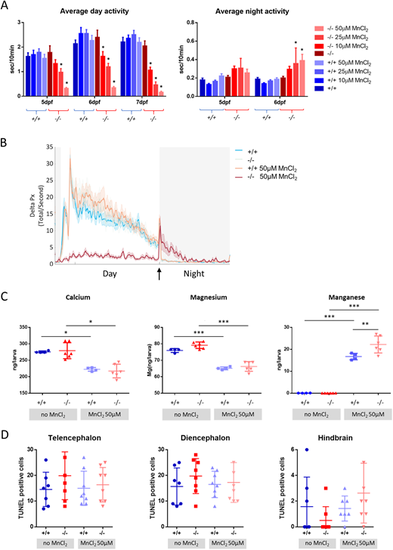
MnCl2 treatment causes locomotor abnormalities and Ca2+dyshomeostasis. (A) Average locomotor activity of wild-type (blue) and slc39a14−/− larvae (red) during the day and night in response to increasing concentrations of MnCl2. Data are presented as mean±s.e.m. (two-way ANOVA with Tukey's posthoc test; *P<0.05), n=24 larvae per group. The y-axes represent the average activity of larval zebrafish in seconds per 10 minutes. (B) Frame-by-frame analysis of the locomotor activity of wild-type and slc39a14−/− larvae at 6 dpf that were unexposed and exposed to 50 µM MnCl2. White shading representing the day (lights ON) and grey shading represents the night (lights OFF). The arrow indicates the ‘lights OFF’ switch. Summed and smoothed Δ pixels traces (Delta Px) are shown as mean±s.e.m. (bold lines and shaded surrounding areas). n=24 larvae per group. (C) Calcium, magnesium and manganese concentrations determined by ICP-MS in untreated and MnCl2 (50 µM)-treated wild-type and slc39a14−/− larvae. Data are presented as mean±s.d. (one-way ANOVA with Tukey's post hoc test; *P<0.05; **P<0.01; ***P<0.001). (D) Apoptotic cell death upon MnCl2 exposure in both wild-type (blue) and mutant (red) larvae at 5 dpf detected by TUNEL staining in the telencephalon, diencephalon and hindbrain. Data are presented as mean±s.d. PHENOTYPE:
|
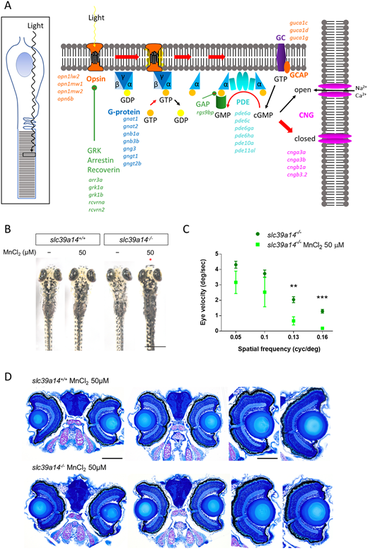
slc39a14−/− mutants develop a visual phenotype upon MnCl2 exposure. (A) Schematic showing the process of phototransduction (Kaupp and Seifert, 2002) with the differentially expressed genes observed in MnCl2-exposed slc39a14−/− mutants indicated in italics. cGMP, cyclic guanosine monophosphate; CNG, cyclic nucleotide-gated non-selective cation channels; GC, guanylyl cyclase; GCAP, guanylate cyclase-activating protein; PDE, phosphodiesterase; GRK, G protein-coupled receptor kinase; GAP, GTPase-activating protein. (B) Dorsal views during light exposure of wild-type siblings (slc39a14+/+, left) and slc39a14−/− larvae (right) at 5 dpf that were unexposed and exposed to 50 µM MnCl2. Note the darker pigmentation of mutants exposed to MnCl2 (red asterisk). Scale bar: 500 µm. (C) Graph showing the eye velocity in response to moving stimuli of different spatial frequencies (average of both eyes) of slc39a14−/− larvae that were unexposed (dark green circles) and exposed to 50 µM MnCl2 (light green squares). Data are presented as mean±s.e.m. from five independent experiments (two-tailed unpaired Student's t-test; **P<0.01; ***P<0.001). (D) Histologic analysis of retinal sections with Richardson–Romeis staining of wild-type siblings (slc39a14+/+, top row) and slc39a14−/− larvae (bottom row) at 5 dpf exposed to 50 µM MnCl2. Scale bars: 200 µm (image of both eyes), 100 µm (image of single eye). |
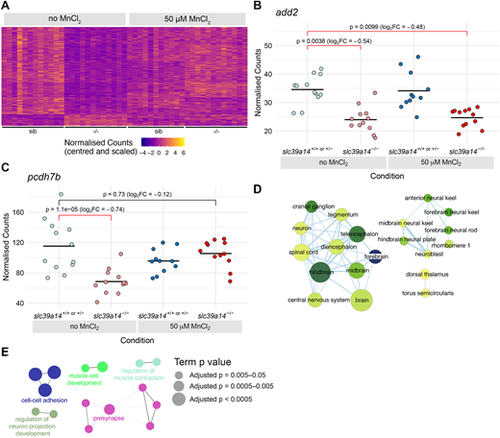
Exogenous Mn restores normal expression of genes that are differentially expressed in unexposed slc39a14−/− mutants. (A) Heatmap of the expression of 266 genes with a significant difference between unexposed mutants and unexposed siblings. Each row represents a different gene and each column is a sample. The normalised counts for each gene have been mean centred and scaled by dividing by the standard deviation. (B) Plot of normalised counts for the add2 gene. Gene expression is decreased in both unexposed and MnCl2-exposed mutant embryos. Unexposed sibling embryos are indicated in light blue and Mn-exposed embryos are in dark blue. Unexposed mutants are coloured light red and exposed mutants are dark red. (C) Plot of normalised counts for the pcdh7b gene. There were decreased counts in the unexposed mutant embryos that were rescued back to wild-type levels upon 50 µM MnCl2 treatment. Colour scheme is as in B. FC, fold change. Wald test was used to determine significance in B,C. (D) Enrichment Map diagram of the enrichment of ZFA terms for the genes differentially expressed in unexposed mutants that are rescued by Mn treatment. Nodes represent enriched ZFA terms and edges connect nodes that share annotations to the significant genes. The width of each edge is proportional to amount of overlap, nodes are coloured by −log10[adjusted P-value] (Wald test) and the size represents the number of significant genes annotated to the term. (E) ClueGO network diagram of the enrichment of GO terms associated with the genes that are rescued by Mn treatment. Nodes represent enriched GO terms and edges connect nodes that share annotations to the significant genes. Different components of the network are coloured according to the categories as labelled on the diagram. The sizes of the circles represent the adjusted P-values for each GO term as indicated on the right (Wald test). |