
|
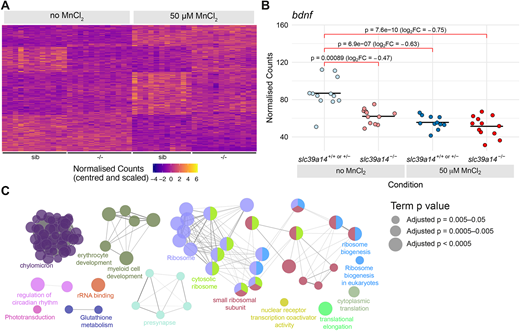
Fig. 2 Manganese overexposure causes neurotoxicity and metabolic defects in slc39a14+/+ or slc39a14+/− embryos. (A) Heatmap of the expression of all 328 genes with a significant difference between exposed and unexposed siblings (Group 1 – Mn toxicity, Table S1). Each row represents a different gene and each column is a sample. Mutant embryos are displayed for completeness; however, the group of genes is defined by the response in siblings only. The normalised counts for each gene have been mean centred and scaled by dividing by the standard deviation. (B) Plot of the normalised counts for each sample of the gene bdnf in Group 1. Unexposed sibling embryos are indicated in light blue and MnCl2-exposed ones are in dark blue. Unexposed mutants are coloured light red and exposed mutants are dark red. FC, fold change. Wald test test was used to determine significance. (C) Enrichment of Gene Ontology (GO) terms associated with the genes in A. Diagram produced using the CytoScape ClueGO app. Nodes represent enriched GO terms and edges connect GO terms that have annotated genes in common. Different components of the network are coloured according to the categories labelled on the diagram. The sizes of the circles represent the adjusted P-values for each GO term as indicated on the right (Wald test). See Fig. S1 for GO enrichment split by up- and downregulation.